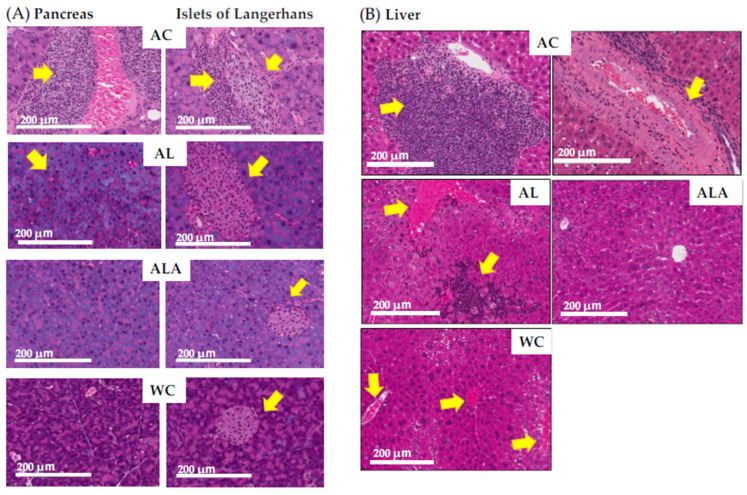
Figure 5.
Histological observation of small intestinal tissue by H&E staining. Photomicrographs of pancreas (A) and liver (B) are representative of tissue cross sections from the AC, AL, ALA, and WC mice. Arrows indicate tissue lesions and study sites. Magnification in the original paper is 200×. Scale bar = 200 μm.

