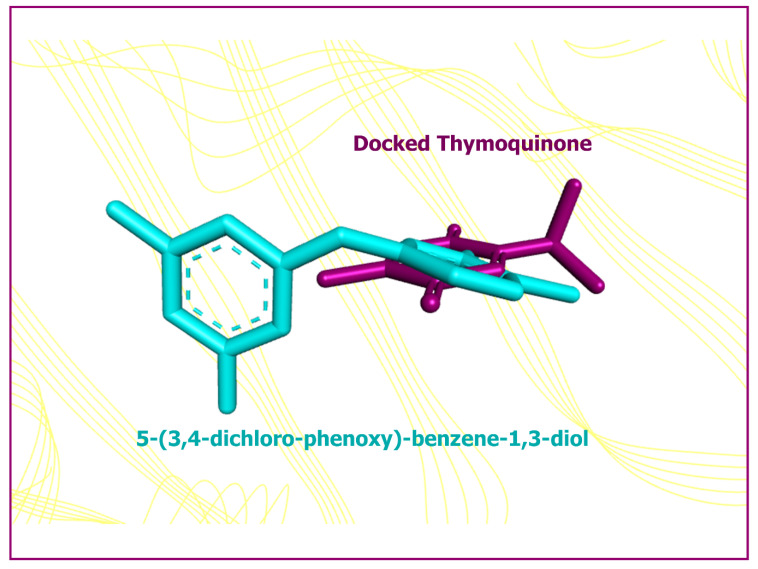
Figure 4.
Superimposition of the minimum energy conformation of the docked TQ (shown in purple color) and the native co-crystallized inhibitor, 5-(3,4-dichloro-phenoxy)-benzene-1,3-diol (shown in cyan color), displaying a root-mean square deviation of 3.23 Å. The Hsp90 protein is shown as line ribbon in a faded yellow color.

