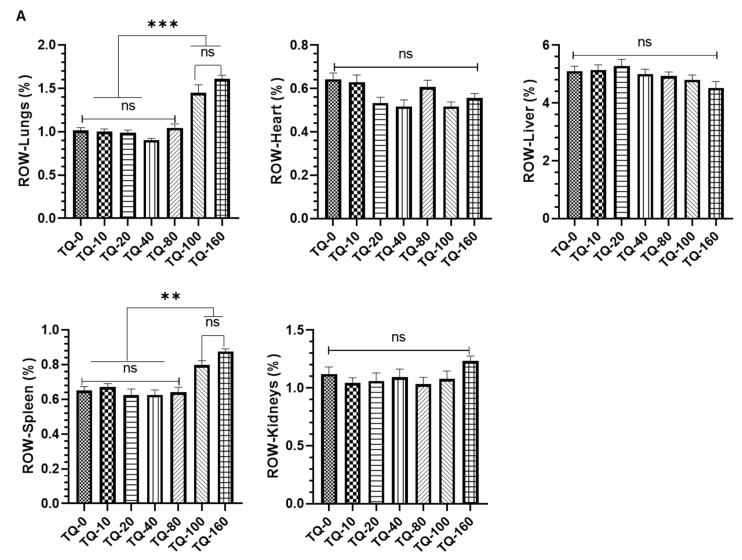
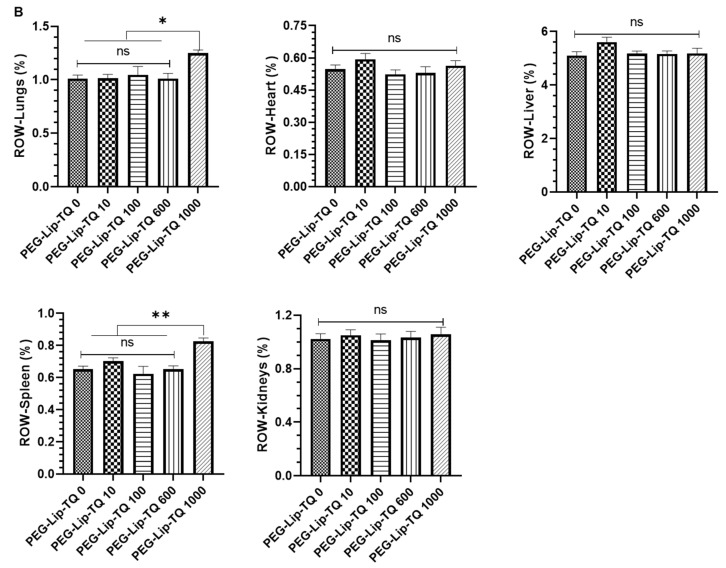
Figure 10.
Effect of TQ on the relative organ weight of vital organs (lungs, heart, liver, spleen, and kidneys) in all the surviving animals from phase 1 and phase 2. The quantitative analysis of ROW from the animals exposed to (A) free TQ (B) PEG-Lip-TQ. The values are expressed as mean ± SE of three independent experiments. NS No significance within the groups, * Significant difference between the treated groups, p-value < 0.05, ** Significant difference between the treated groups, p-value < 0.001, *** Significant difference between the treated groups, p-value < 0.0001.


