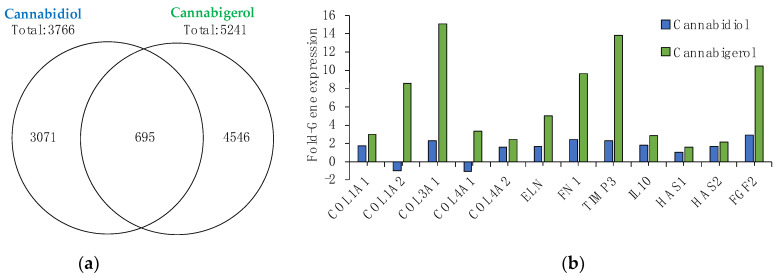
Figure 1.
Gene microarray analysis of CBG and CBD. (a) Gene differential expression was quantified using Clariom™ S assay microarray system method after 24 h incubation in 3D skin model EpiDerm-FT™. (b) Data subset of gene expression related to skin. Data represent mean from n = 3 tissues. All genes shown were significantly different (p value < 0.05) relative to vehicle-only treated tissues.

