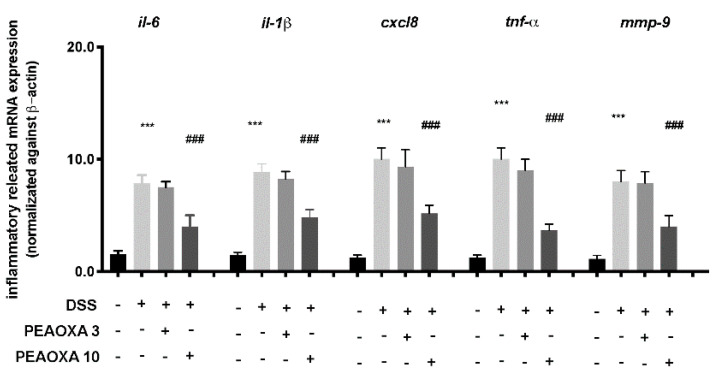
Figure 3.
Effect of PEAOXA on mRNA expression of cytokine genes along the zebrafish intestine in presence (+) or absence (-) of DSS and PEAOXA 3 or 10 mg/L exposure. Expression values are normalised against the expression of β-actin mRNA, which was not significantly different between any of the treatment groups. Values represent the mean ± SE *** p < 0.001 compared with CTRL at the same time point and ### p < 0.001 relative to DSS 0.1% group.

