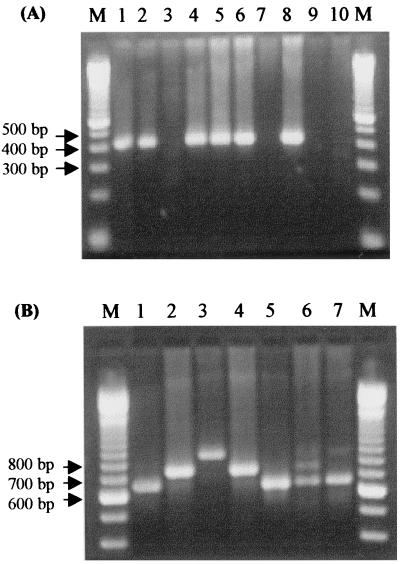
FIG. 1.
Analysis of the cagA gene by PCR using primers for the consensus region (A) and for the variable 3′ region (B). (A) PCR products (400 bp) from positive cagA isolates (lanes 1, 2, 4, 5, and 6) and negative isolates (absence of PCR products) (lanes 3 and 7). Lane 8, positive control; and lanes 9 and 10, negative controls. (B) PCR products ranging from 650 to 850 bp from cagA-positive isolates. Fragments of 650 bp (type A) (lanes 1 and 5), fragments of 750 bp (types B/D) (lanes 2 and 4), and fragments of 850 bp (type C) (lane 3) were obtained. Lane 6, from a patient with types A, B/D, and C; lane 7, from a patient with types A and C; lane M, molecular size marker ladder, 100 bp.

