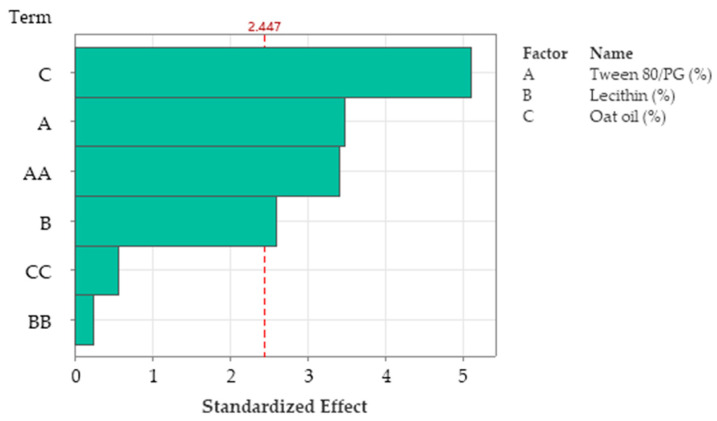
Figure 21.
Pareto Chart of standardized effect for W response, emphasizing the main factors implied in the definition of response, namely C: Oat oil (%), A: Tween 80/PG (%), AA: Tween 80/PG (%) × Tween 80/PG (%) as squared term, and B: Lecithin (%), where the factors CC: Oat oil × Oat oil and BB: Lecithin × Lecithin were insignificant.

