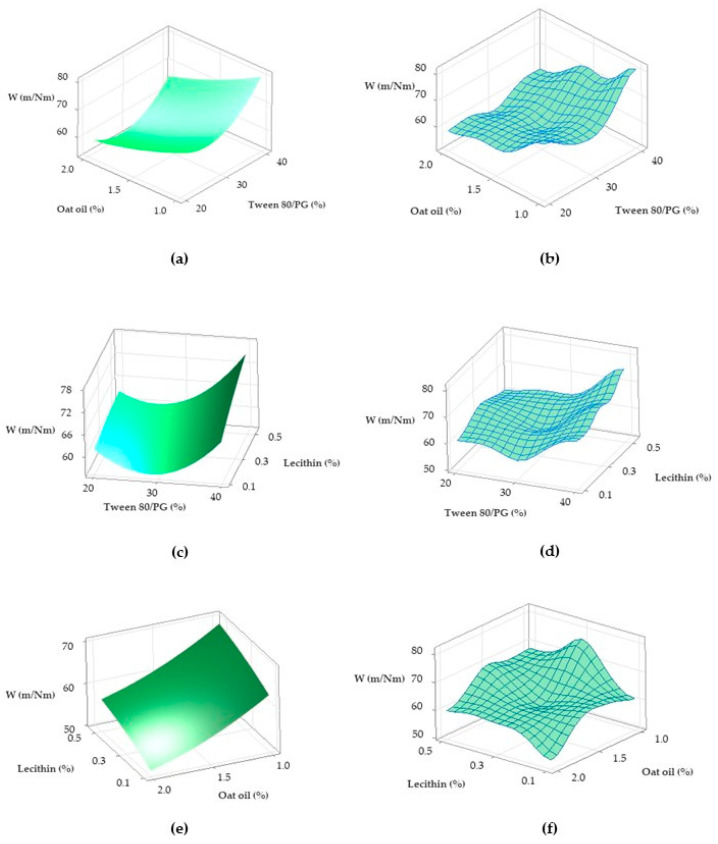
Figure 23.
Surface plots representing: W response (Y3) as a function of Tween 80/PG (%) and Oat oil (%), in two cases—(a) Surface representation in gradient color, (b) Wireframe model; W response (Y3) as function of Tween 80/PG (%) and Lecithin (%), in two cases—(c) Surface representation in gradient color, (d) Wireframe model; W response (Y3) as function of Oat oil (%) and Lecithin (%) in two cases—(e) Surface representation in gradient color, and (f) Wireframe model.

