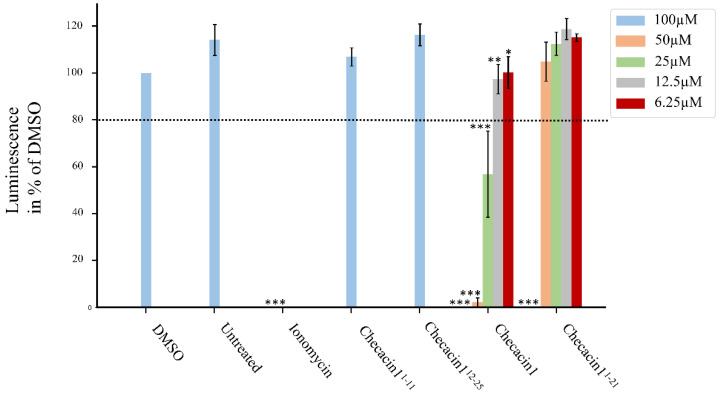
Figure 3.
Cell viability assay of MDCK II cells treated with varying concentrations of Checacin1 and Checacin1 fragments. Cell viability was assessed based on CellTiter–Glo® (Promega GmbH, Walldorf, Germany) which measures luminescence as an indicator for ATP amount. The luminescence signal of the 100 µM treatment of Checacine1 and Checacin11−21 was at 0% and therefore not detectable. Luminescence was normalized to the DMSO control; data are presented as mean ± SD (n = 4–6). DMSO: dimethyl sulfoxide. Significant differences to the negative control (Untreated) were assessed by t-statistics and are indicated by ‘*’ for p < 0.1, ‘**’ for p < 0.05 and ‘***’ for p < 0.01.

