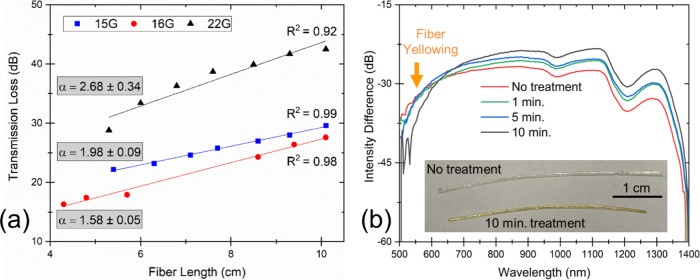
Figure 5.
(a) Transmission loss measured as a function of fiber length using a visible 637 nm laser for three different CMC fiber samples. The data was fitted linearly, and the slope of the fitted straight line denotes the attenuation constant (α) for the fibers, measured in dB·cm–1. (b) Transmission spectra for 16G fiber samples with 0, 1, 5, and 10 min of heat treatment at 160 °C. The inset image shows the apparent yellowing of fiber after 10 min heat treatment.

