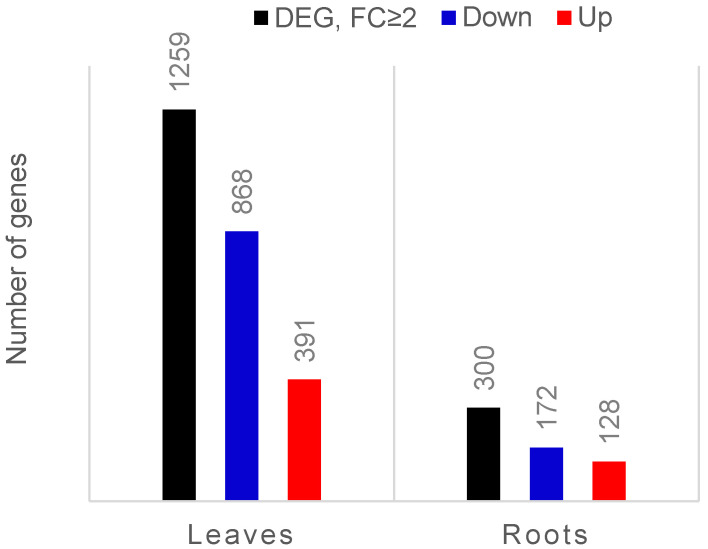
Figure 1.
Bar chart showing the number of differentially expressed genes (DEGs; FDR-corrected p-value ≤ 0.05) in leaves and roots of endophyte-colonised compared to endophyte-free tomato plants. The black bars represent the total number of DEGs that exhibited at least two-fold changed expression (FC ≥ 2). Upregulated genes are marked in red and downregulated genes are marked in blue.

