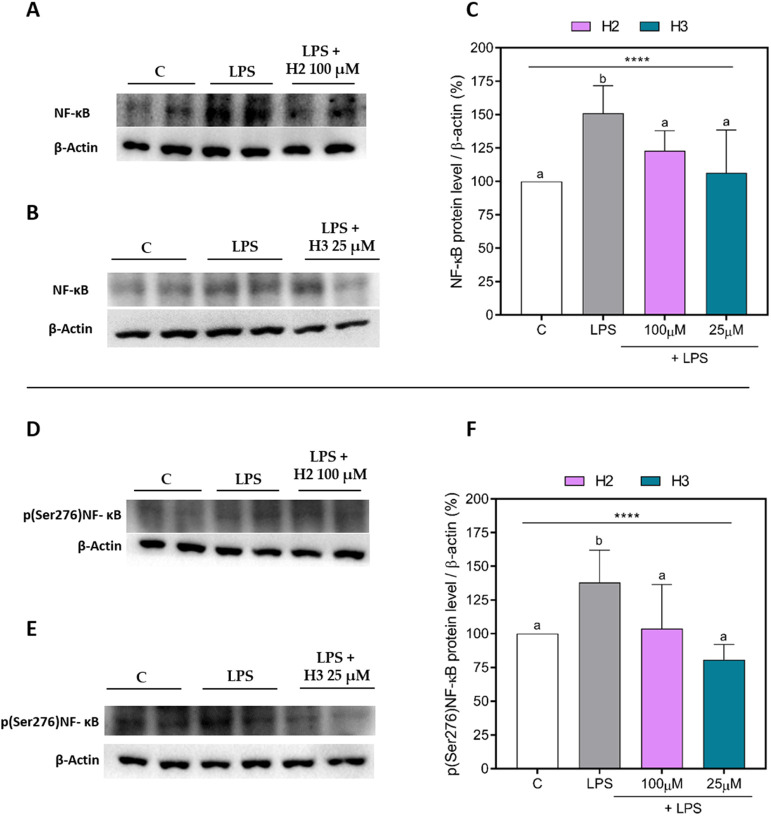
Figure 1.
NF-κB and p(Ser276)NF-κB protein levels in LPS-stimulated HepG2 cells. Upper panel: representative Western Blots of NF-κB in H2 (A) and H3 (B) assays. Densitometric analyses of NF-κB (C). Bottom panel: representative Western Blots of p(Ser276)NF-κB in H2 (D) and H3 (E) assays. Densitometric analyses of p(Ser276)NF-κB (F). The data points represent the averages ± SD of three independent experiments in triplicate. All data sets were analyzed by one-way ANOVA, followed by Tukey’s post-hoc test. Different letters indicate statistically significant differences. ****, p ≤ 0.0001. C, unstimulated control group; LPS, lipopolysaccharide-stimulated cells; NF-κB, nuclear factor-κB; p(Ser276)NF-κB, phosphor(Ser276)-nuclear factor-κB.

