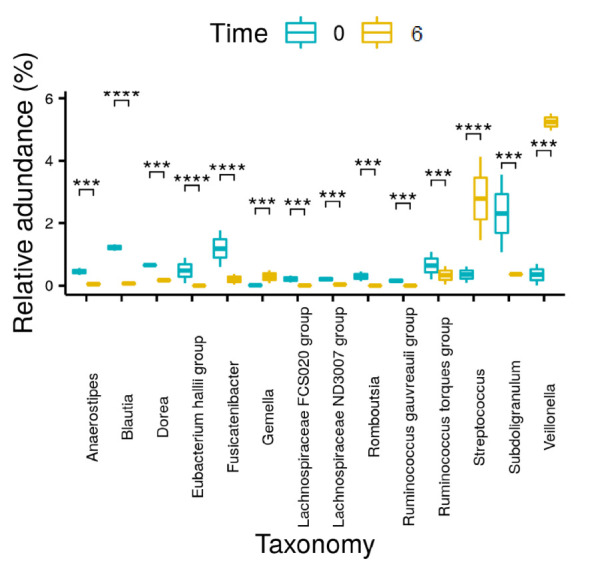
Figure 3.

Changes in relative abundances of genera for all patients (n = 28) from baseline (Time 0) to 6 months post-surgery (Time 6). Significant differences in abundance are marked with an asterisk (*** indicates p < 0.0005; **** indicates p < 0.00005). Note that only significant differences in abundance with p < 0.0005 are presented here.
