Figure 4.

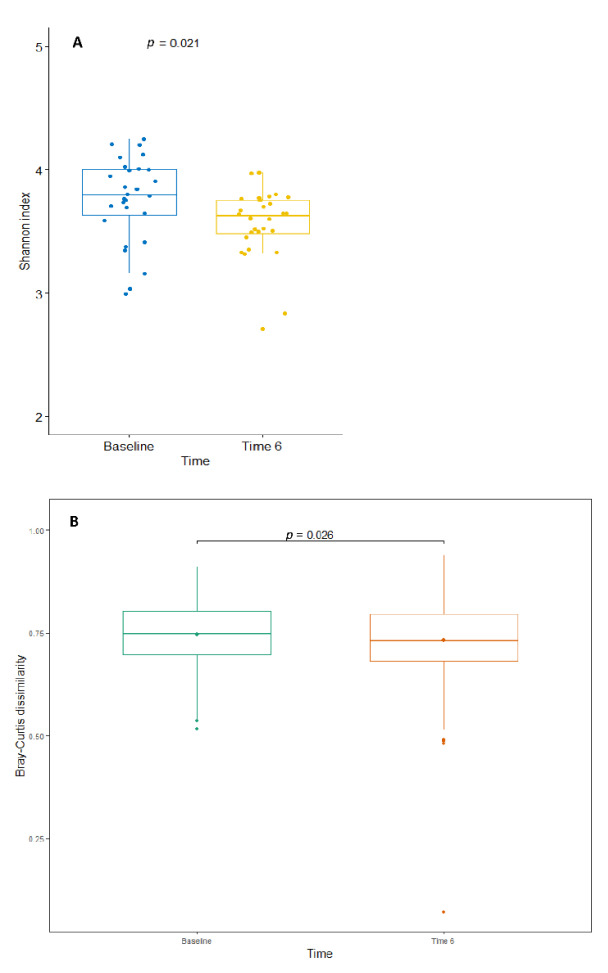
(A) Alpha diversity (using the Shannon index) and (B) beta diversity (using the Bray–Curtis dissimilarity metric) for all patients (n = 28) from baseline (Time 0) to 6 months post-surgery (Time 6).

(A) Alpha diversity (using the Shannon index) and (B) beta diversity (using the Bray–Curtis dissimilarity metric) for all patients (n = 28) from baseline (Time 0) to 6 months post-surgery (Time 6).