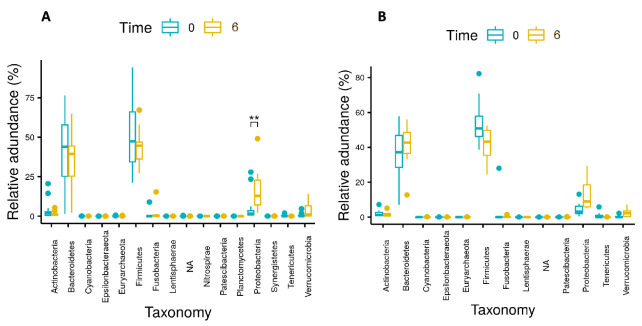
Figure 5.
Changes in relative abundances of phyla for (A) patients (n = 17) who did not develop SIBO and (B) patients (n = 10) who developed SIBO from baseline (Time 0) to 6 months post-surgery (Time 6). Significant differences in abundance are marked with an asterisk (** indicates p < 0.005). NA = sequences that were assigned to the kingdom bacteria but were not assigned to a specific phylum.

