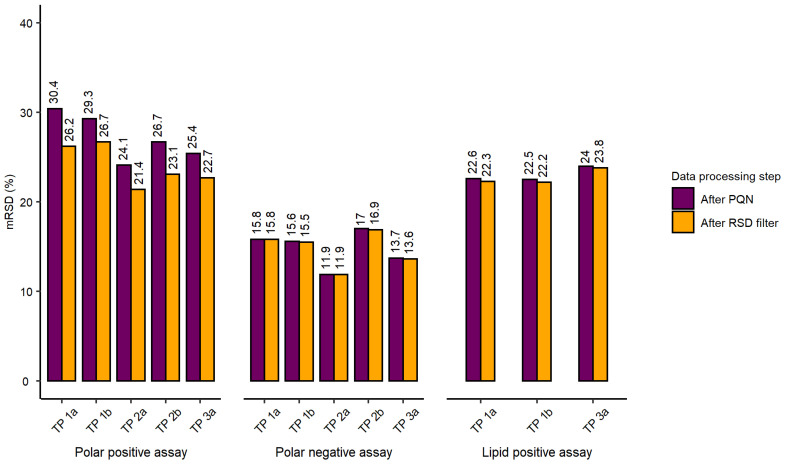
Figure 1.
Results presented for all three nESI-DIMS assays (polar positive, polar negative and lipid positive) with 96-well microplates, labelled as “test plates” or “TP”, indicating the order of their extraction (1–3) and position on the instrument’s deck (a-b) following normalisation (termed “After PQN”), and filtering of variable features (termed “After RSD filter”). For each 96-well microplate, median relative standard deviation (mRSD (%)) of spectral feature intensities was calculated before and after the RSD filtering (i.e., removal) of spectral features for which the feature RSDs exceeded 30% in intrastudy QC samples.

