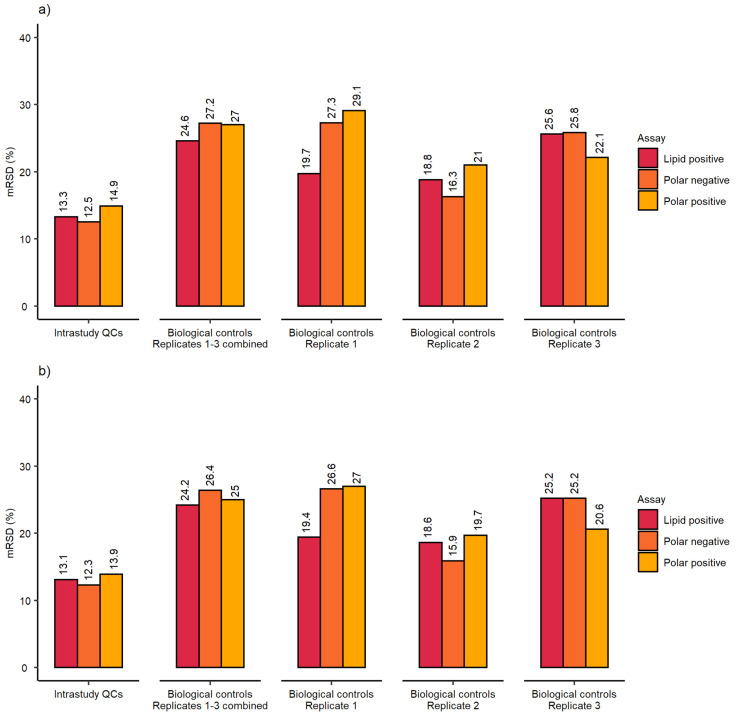
Figure 3.
mRSD (%) of spectral feature intensities using control samples at 24 h from the high-throughput metabolomics study (a) before and (b) after RSD filtering for HepaRG control samples: n = 3 biological control replicates (here defined as replicates prepared across multiple weeks of cell culture), each measured as n = 9 technical replicates (here defined as replicates wells of cells cultured within the same test 96-well microplate).

