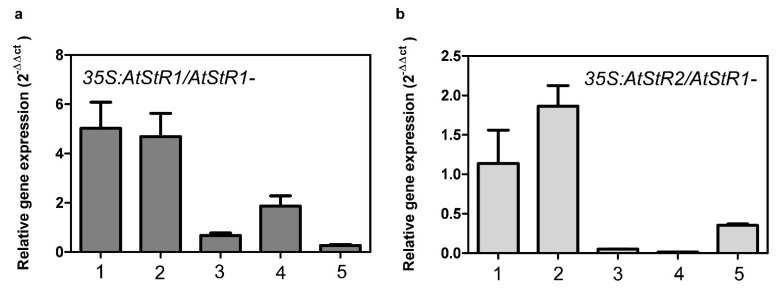
Figure 5.
Expression of AtStR1 gene in transgenic 35S:AtStR1/AtStR1- (a) and expression of AtStR2 gene in 35S:AtStR2/AtStR1- mutant lines (b). mRNA values were measured by quantitative real-time PCR, quantified by 2−ΔΔctmethod using Act2 and EF1α as reference genes (n = 3). Numbers 1–5 indicate individual lines 35S:AtStR1/AtStR1-1–5 and 35S:AtStR2/AtStR1-1–5.

