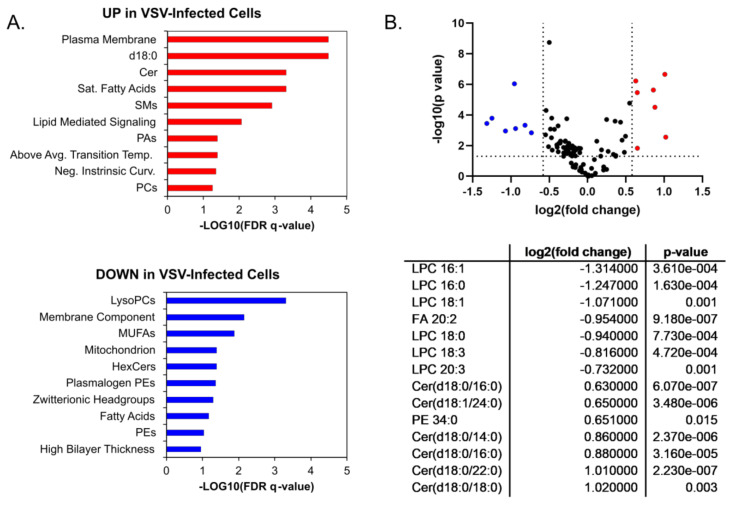
Figure 4.
Ontology and significantly altered lipids. Enrichment ontology analysis performed in LION/web for (A) Upregulated lipids (in red) and downregulated lipids (in blue); (B) Lipid changes displayed according to fold change and p-value threshold significance cutoffs of 1.5 and 0.05, respectively. P-values were determined by Student’s t-test (two-tailed, equal variance). Significantly upregulated (red) and downregulated lipid species (blue) are listed in the table in the lower panel.

