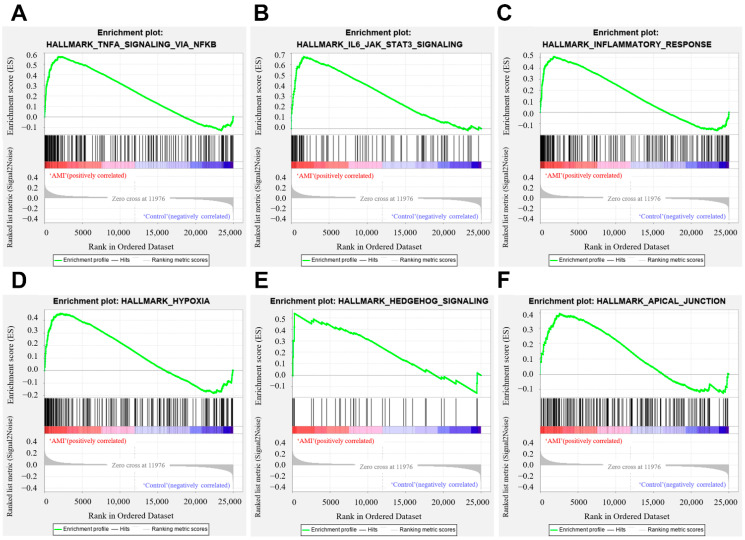
Figure 5.
Gene set enrichment analysis. (A) Enrichment plot of ‘TNFA_SIGNALING_VIA_NFKB’ with enrichment score 0.57, FDR q-value 0.0. (B) Enrichment plot of ‘IL6_JAK_STAT3_SIGNALING’ with enrichment score 0.67, FDR q-value 0.0. (C) Enrichment plot of ‘INFLAMMATORY_RESPONSE’ with enrichment score 0.51, FDR q-value 0.004. (D) Enrichment plot of ‘HYPOXIA’ with enrichment score 0.46, FDR q-value 0.0025. (E) Enrichment plot of ‘HEDGEHOG_SIGNALING’ with enrichment score 0.54, FDR q-value 0.05. (F) Enrichment plot of ‘APICAL_JUNCTION’ with enrichment score 0.40, FDR q-value 0.047.

