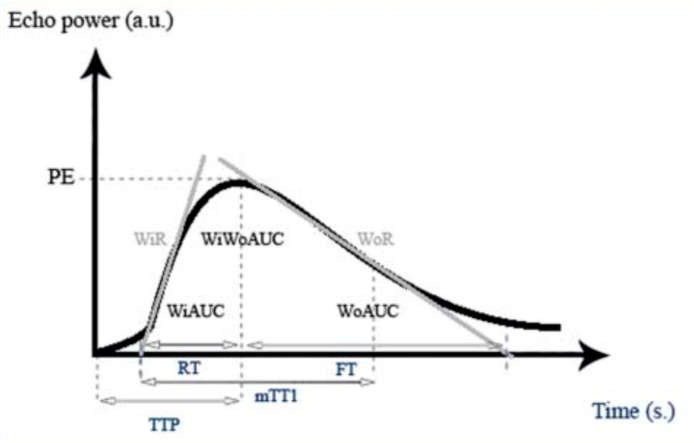
Figure 3.
Signal intensity (echo power) in arbitrary units (a.u.), as a function of time in seconds (s), in a parathyroid lesion. Contrast enhancement increases until reaching Peak-Enhancement (PE). Wash-in area under the curve (WIAUC), Wash-in Perfusion Index (WiPI), Wash-in Rate (WiR), Wash-out area under the curve (WoAUC), Wash-in and Wash-out area under the curve (WiWoAUC), Wash-out Rate (WoR), Time to Peak (TTP), rise time (RT), mean transit time (local) (mTTl) and fall time (FT), permission to use the image is provided [20].

