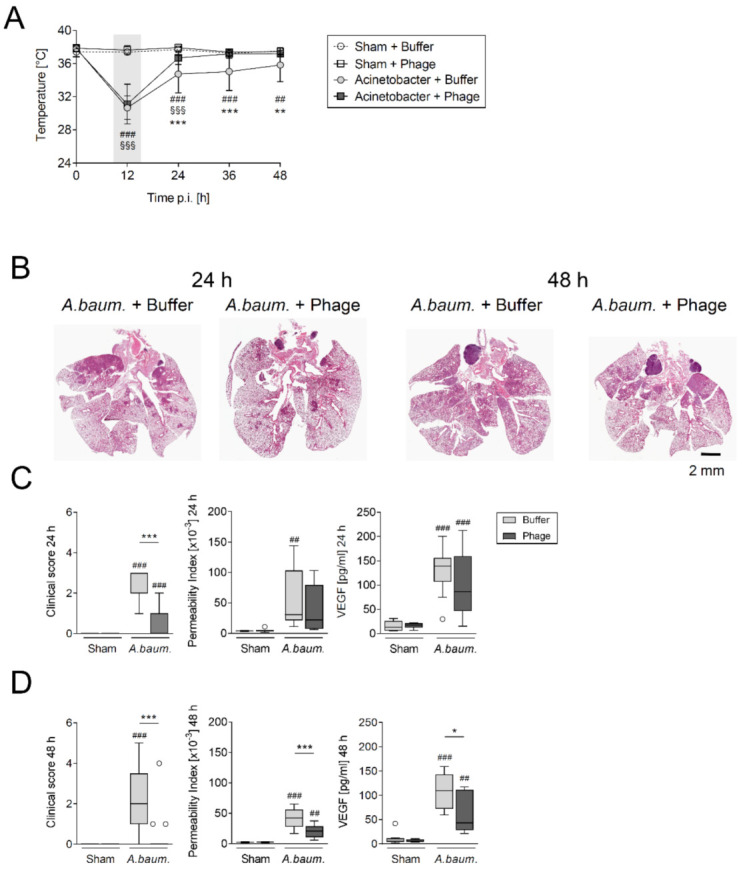
Figure 1.

Phage therapy mitigated murine A. baumannii pneumonia. Mice were transnasally infected with 5 × 10⁸ CFU A. baumannii RUH 2037 or sham-infected (DPBS) and intratracheally treated with specific phage, vB_AbaM_Acibel004, or control solution (buffer) 12 h post infection (p.i.). At defined time points mice were sacrificed for BAL and blood sampling. Separate groups were sacrificed for histological analyses. (A) Body temperature curves of all mice subjected to analysis at 24 h (n = 11–12; sham-infected groups or n = 16–17; A. baumannii infected groups) and 48 h (n = 12; sham-infected groups or n = 17; A. baumannii infected groups) are shown combined (mean ± SD). Representative images of H&E-stained whole lung sections from A. baumannii infected buffer or phage-treated mice are shown at 24 h and 48 h p.i. (B); n = 3–4 (sham-infected groups), n = 6 (A. baumannii infected groups). Murine clinical disease score, permeability index and VEGF levels in BAL were assessed at 24 h (C) and 48 h p.i. (D). Data are presented as box plots depicting median, quartiles, and range excluding outliers (open circles) and analyzed using 2-way ANOVA and Tukey’s multiple comparisons test. C and D (clinical score), n = 11–12 (sham-infected groups) or n = 16–17 (A. baumannii infected groups; including 3 mice euthanized due to humane endpoints); C and D (permeability index and VEGF levels), n = 8 (sham-infected groups) or n = 8–11 (A. baumannii infected groups). Grey box in A marks time point of phage application. §/#/* indicate significant differences between groups at corresponding time point; § sham + phages vs. Acinetobacter + phages (A), # infected vs. corresponding sham group, *Acinetobacter + buffer vs. Acinetobacter + phages, * p < 0.05, ##/** p < 0.01 and ###/***/§§§ p < 0.001.
