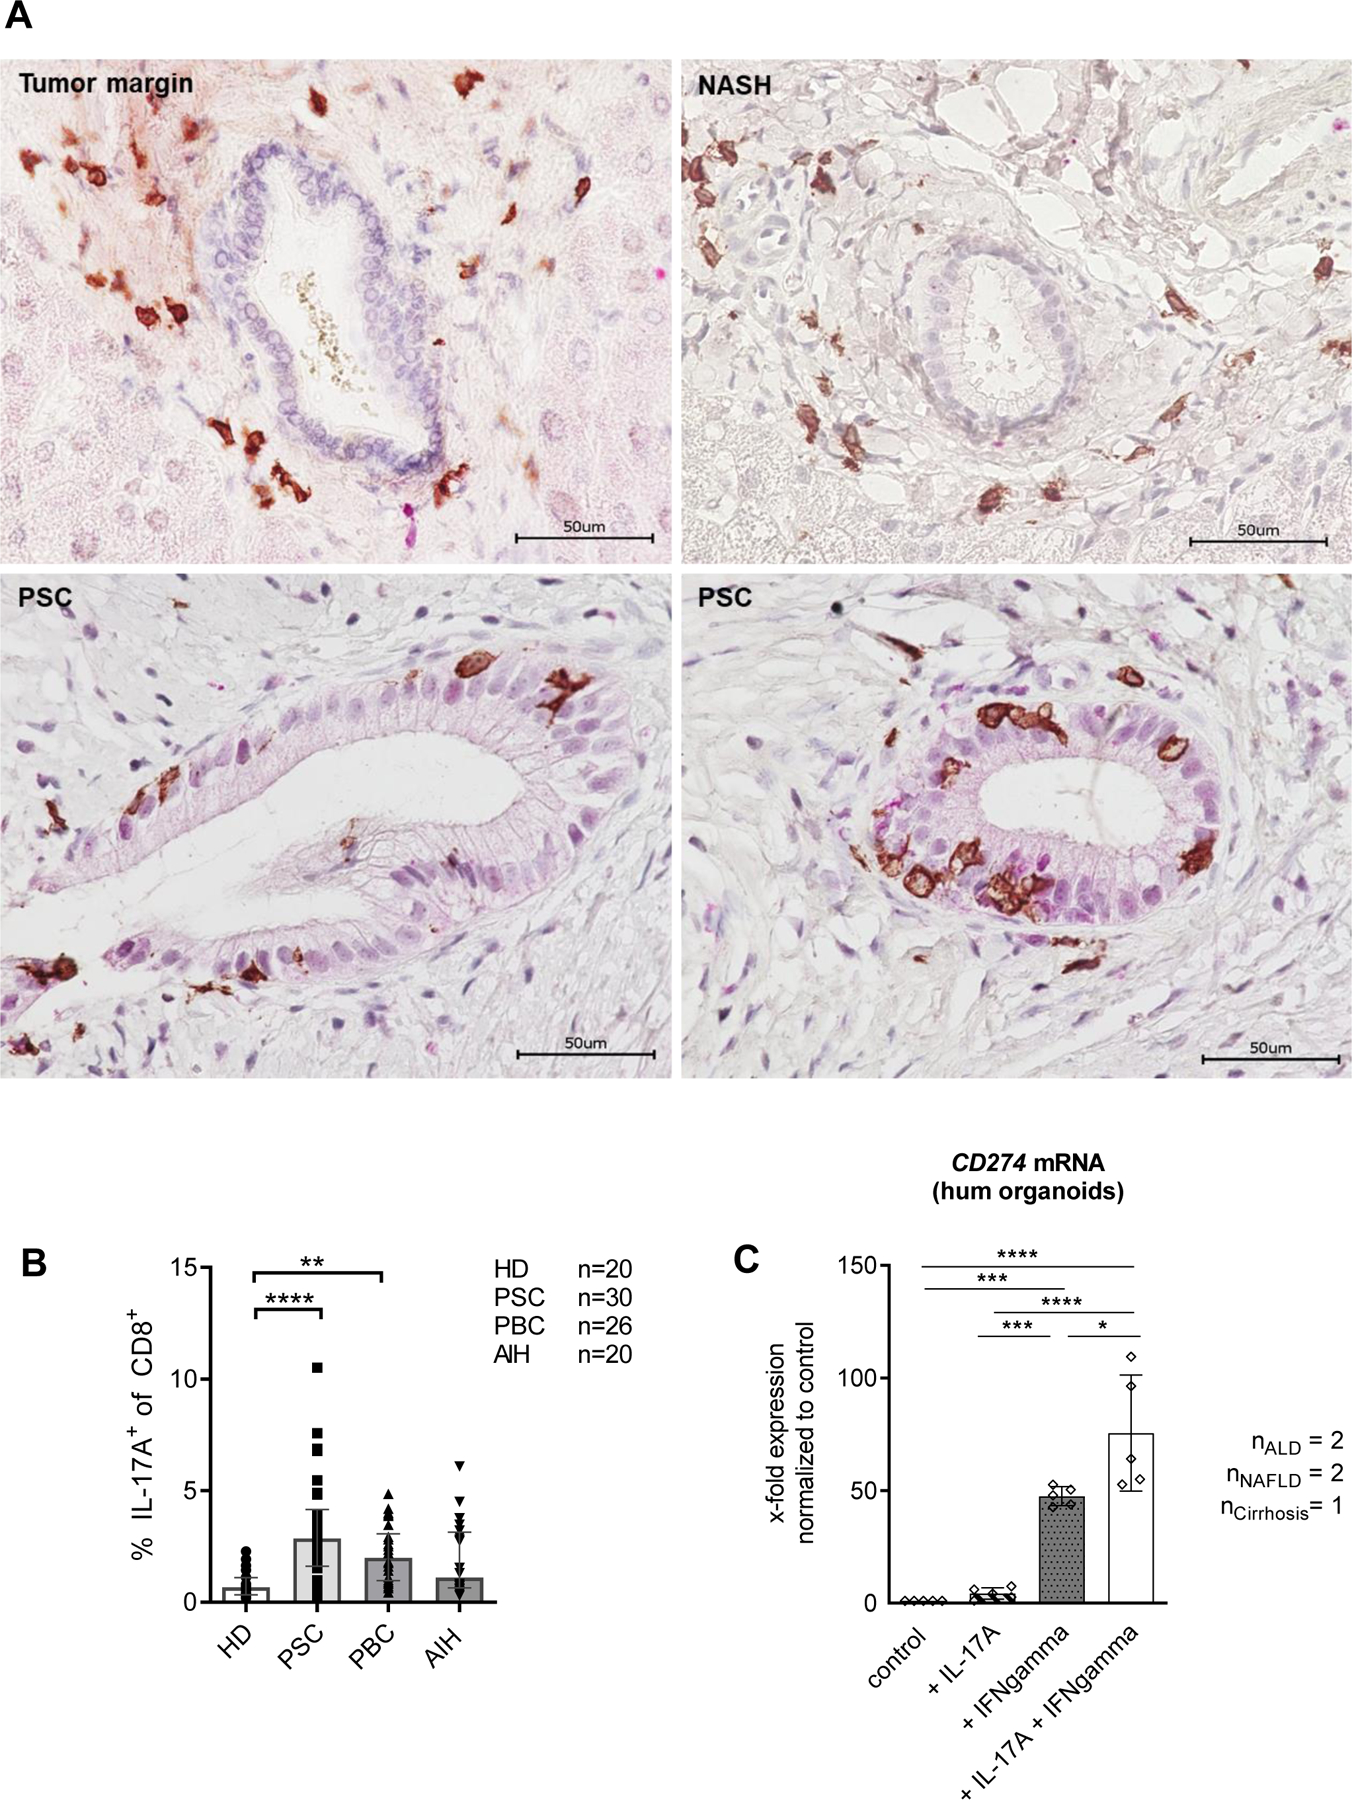
Fig. 6. Presence of CD8+IL17A+ producing T cells in cholestatic liver diseases.

(A) Immunohistochemical double staining for CD8 (brown) and IL-17A (red) in explant liver sections from NASH and PSC, and from unaffected tissue derived from tumour margin. (B) Peripheral blood of patients with PSC (n=30), PBC (n=26), AIH (n=20) and healthy donors (n=20) was stimulated with PMA/Ionomycin for 4 h and analyzed for cytokine production using flow cytometry. (C) CD274 mRNA expression was measured using qPCR in human liver derived organoids generated from ALD (n=2), NAFLD (n=2) and cirrhosis of unknown origin (n=1) following cytokine stimulation for 24 h. (B) Data were analyzed using the Kruskal-Wallis test, followed by Dunn’s Multiple Comparison **p≤0.01, ***p≤0.001. Bars represent mean ± SD. Levels of significance: *p≤0,05; ***p≤0,001; ****p≤0,0001 (ordinary one-way ANOVA).
