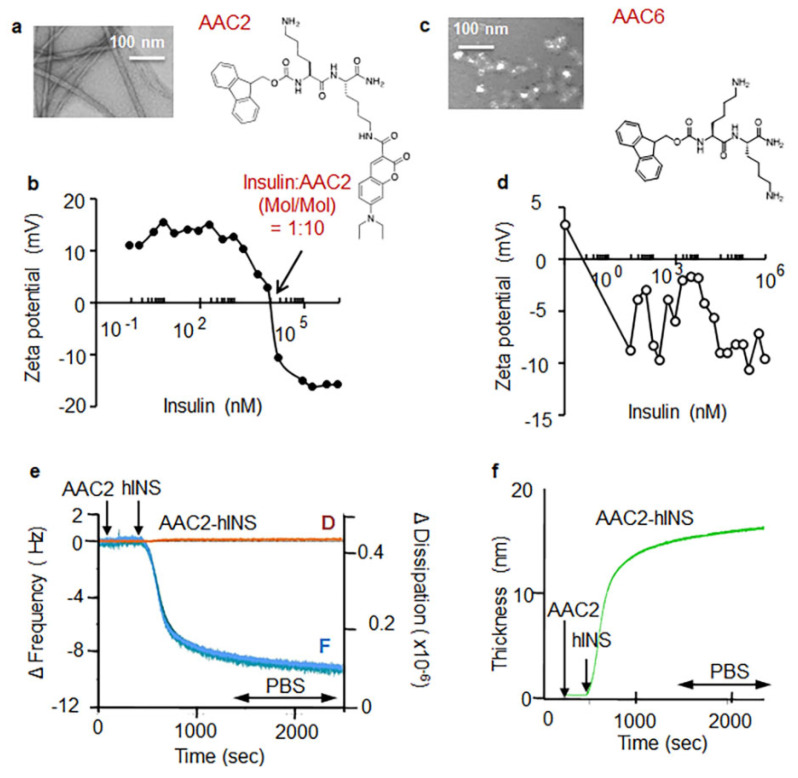
Figure 1.
AAC2 is self-assembled into a positively charged nanofiber, which electrostatically bound insulin. (a,c) The morphology (TEM at 225,000 magnification) and chemical structure of AAC2 (b,d) Electrostatic interaction between AAC2 (0.1 mM in PBS) (b) or AAC6 (d) and negatively charged hINS measured as changes in Zeta potential (mV). 1:10 hINS:AAC2 (mol/mol) indicated 0 mV. (e) Binding kinetics of AAC2 (0.1 µM in PBS) and hINS (10 µg/mL in PBS) onto the active gold sensor was measured as changes in frequency (F, blue line) and dissipation (D, orange line) of the acoustic wave using quartz crystal microbalance (QCM). AAC2-hINS film was stable during PBS wash (arrow). (f) The thickness of AAC2-hINS film (15 nm) was calculated based on F and D kinetics.

