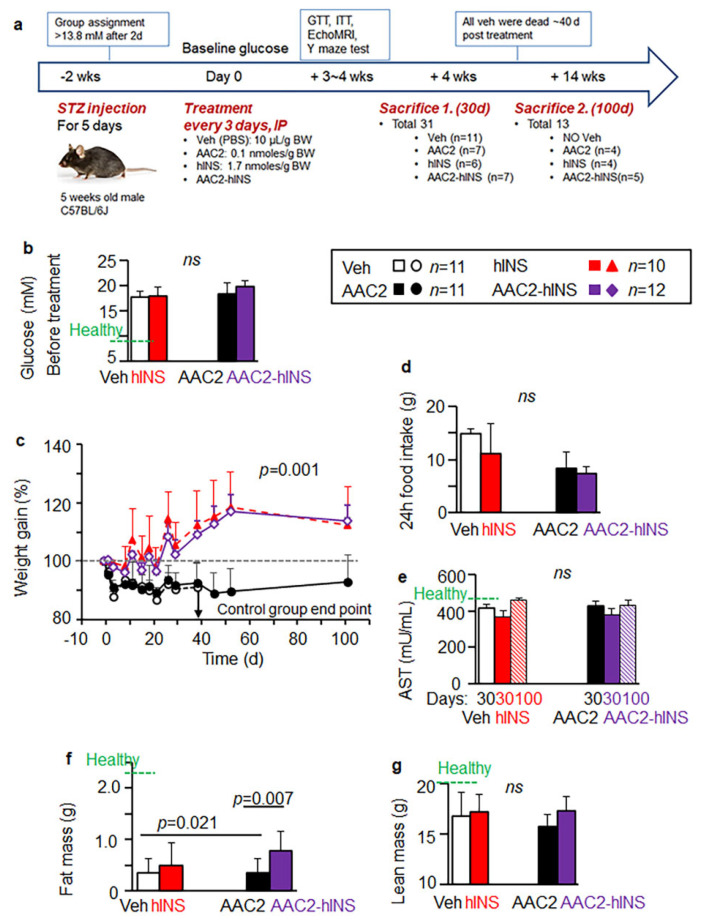
Figure 4.
Improved body composition in AAC2-hINS-treated mice with STZ-induced T1D. (a) Schematic presentation of induction of experimental T1D by streptozotocin (STZ mice, total n = 44 mice) and treatment protocol of control group with vehicle, AAC2, hINS, AAC2-hINS complex. Treatments were administered intraperitoneally (i.p.) every 3 days. After starting treatments, mice died or were sacrificed prior to the death (30 days group). The surviving mice continued with treatments for 100 days. (b) Glucose levels (mM) in STZ-induced mice groups prior to the treatment. One-way ANOVA. p = 0.157; not significant, ns. Green dashed line-the fasting glucose levels in healthy mice. (c) Weight gain of the STZ mice was measured until they succumbed to the diseased (n = 7) or were sacrificed. Data are shown as % of baseline body weight of each animal before induction of T1D (100%, gray dash line). Overall comparison p = 0.001 (Kruskal–Wallis test with a Mann–Whitney U-test for post hoc testing). For (d) Food intake was collected for 24 h on multiple days. (e) Plasma aspartate aminotransferase (AST) levels in plasma of the STZ mice were measured after 30 days and 100 days post treatment. One-way ANOVA. ns, not significant. Green dashed line-the AST levels in healthy mice (n = 6). (f,g) Fat (f) and lean (g) body mass of the STZ mice and healthy mice (dashed line, n = 6) were measured using Echo-MRI 3 weeks after. p = 0.043 for overall comparison of fat body mass. ns, ANOVA.

