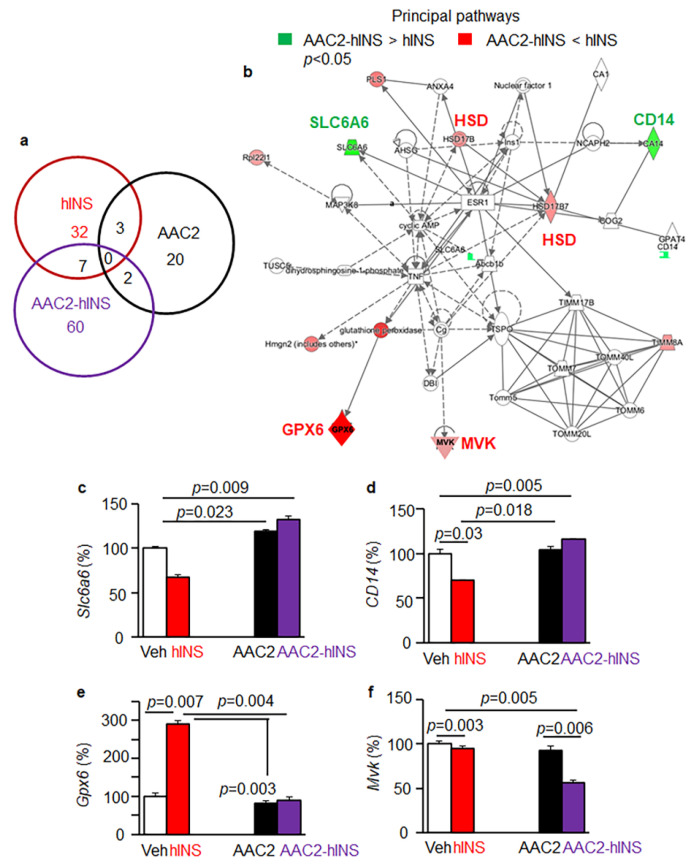
Figure 6.
AAC2-hINS treatment regulated a distinct set of genes compared to its free constituents. (a) Comparison of unique and overlapping the expression of hepatic genes, that were significantly different from the control (Veh, not shown, n = 3, cut off were ≥1.5 fold difference and p < 0.01) across STZ mice treated with AAC2 (black), hINS (red), and AAC2-hINS (purple), (n = 3/group). Gene expression was analyzed by Affymetrix GeneChip. (b) Ingenuity pathway analysis was performed based on the statistically different genes predicted metabolic hubs that were distinctly regulated in response to hINS vs. AAC2-hINS treatments. Green shapes indicate higher expression in AAC2-hINS vs. hINS groups, such as Slc6a6 (c) and CD14 (d). Red shapes show the higher expression of genes in IPA analysis in mice treated with free hINS vs. AAC2-hINS, such as Gpx6 (e) and Mvk (f).

