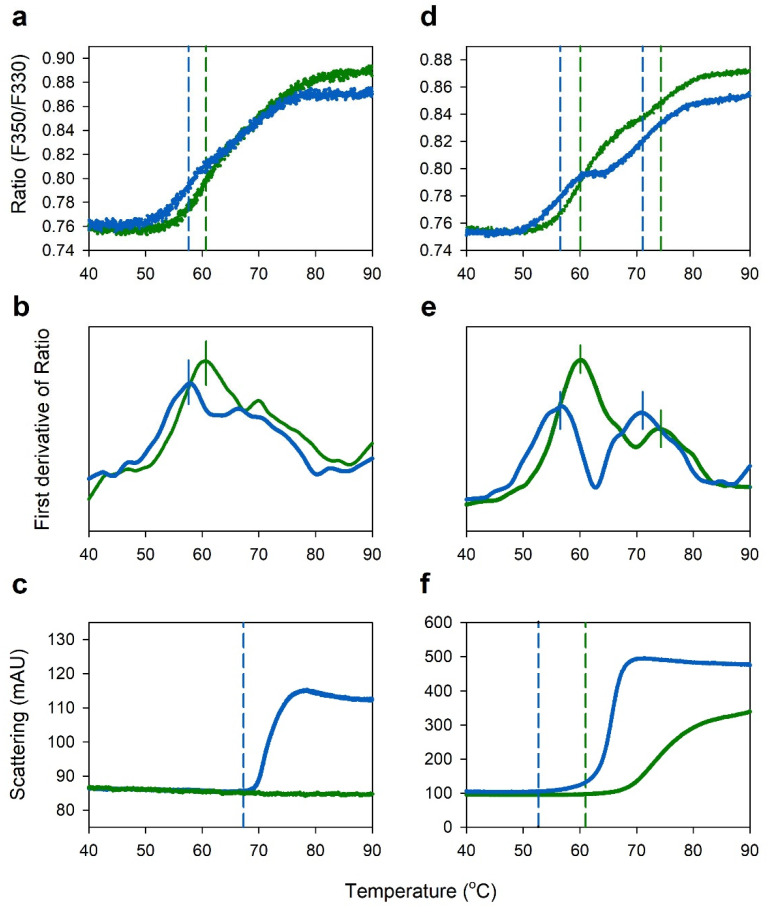
Figure 4.
NanoDSF thermograms of IgGs at concentrations of 1 mg/mL (a–c) and 100 mg/mL (d–f) in acetate (green) and citrate buffers (blue) at the same pH 4.6. (a,d) fluorescence intensity ratio (F350 nm/F330 nm); (b,e) first derivative of fluorescence intensity ratio; (c,f) light scattering thermograms.

