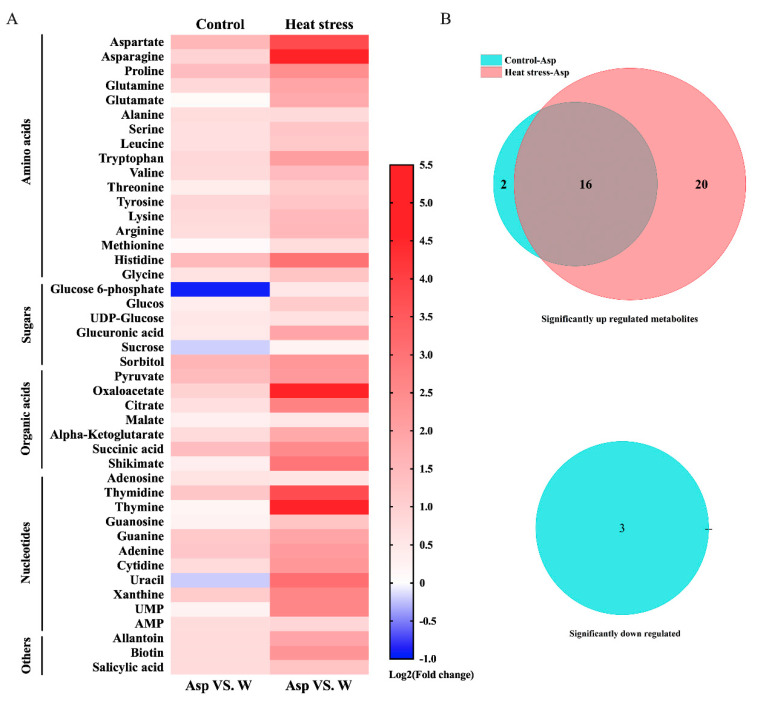
Figure 4.
Heat map showing fold-changes for metabolites responsive to aspartate (Asp, 2 mM) with increases (up-regulation showing in red bars) or decreases (down-regulation showing in blue bars) in metabolite content in plants due to Asp treatment in comparison to metabolite content in the water-treated plants of perennial ryegrass under control temperature and heat stress (A). Venn diagram analysis demonstrating the number of significant up-regulated and down-regulated metabolites by Asp in perennial ryegrass under control temperature and heat stress (B).

