Figure 1.
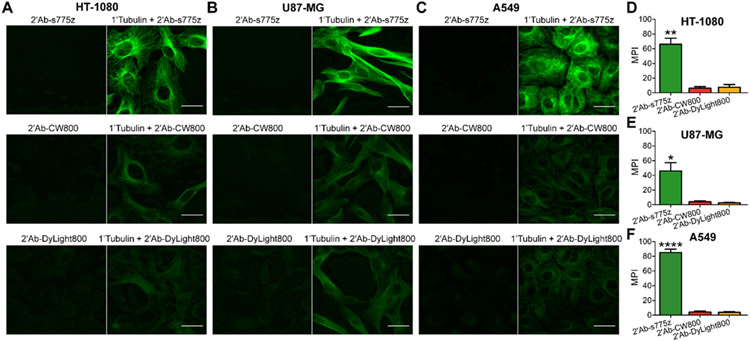
Comparison of secondary goat anti-rabbit IgG antibodies labeled with NIR dyes for targeting primary anti-Tubulin in fixed cells. HT-1080, U87-MG, and A549 cells were fixed, incubated with anti-Tubulin overnight at 4 °C, and incubated the following day with a fluorescent secondary antibody (2’Ab-s775z, 2’Ab-CW800, or 2’Ab-DyLight800) for 2 hr at room temperature. (A,B,C) Representative epifluorescence cell micrographs depict fluorescent secondary antibody without (left) or with primary anti-Tubulin (right). (D,E,F) Graphs of mean pixel intensity (MPI) for cell micrographs, where the cells were incubated with primary anti-Tubulin and a fluorescent secondary antibody. Scale bar = 30 μm. p-value < 0.05 (*), <0.01 (**), < 0.0001 (****)

