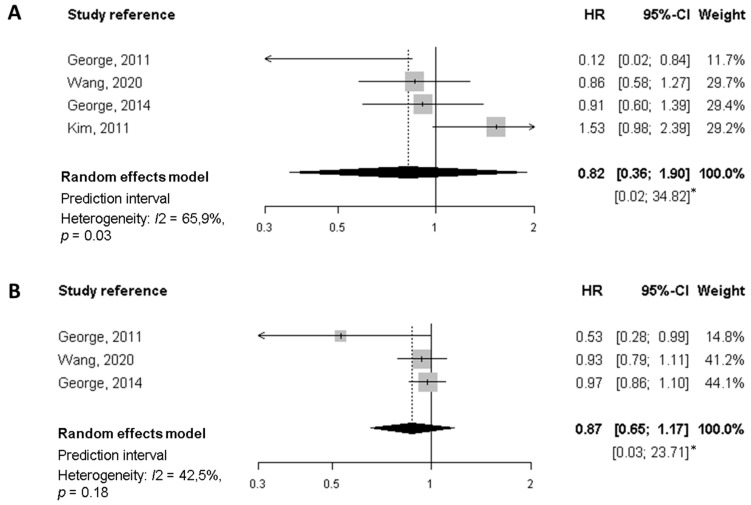
Figure 3.
Meta-analysis of prospective cohort studies on the association between quality diet score and breast cancer-specific mortality among breast cancer survivors. (A) Forest plot showing pooled hazard ratios (HRs) with 95% CI for the highest diet quality (Healthy Eating Index [HEI], Alternate Health Eating Index [AHEI]) vs lowest diet quality category for breast cancer-specific mortality. (B) Forest plot showing pooled HRs with 95% CI for 10-point increase in the quality diet score and breast cancer-specific mortality. * Prediction interval lines are not represented in this figure because intervals are too wide.

