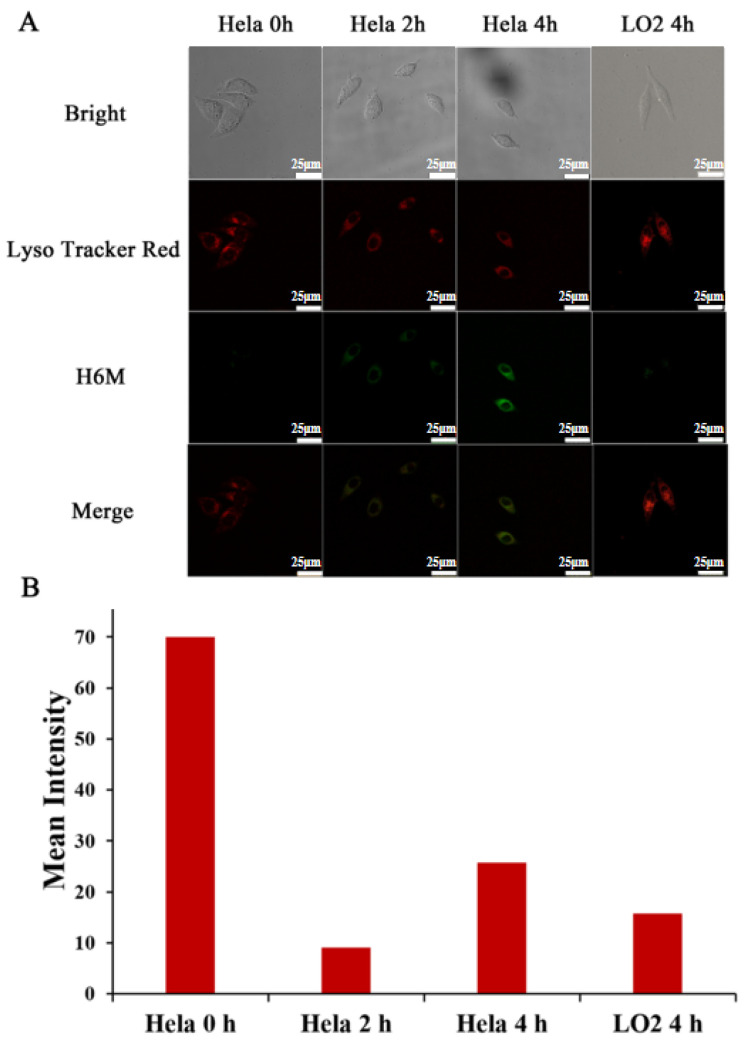
Figure 7.
Intracellular fluorescence activation of H6M. (A) Confocal fluorescence images of HeLa and LO2 cells treated with H6M and LysoTracker red at different timepoints. Scale bar = 25 μm. (B) Mean fluorescence intensity of H6M in HeLa and LO2 cells were quantified at selected timepoints after incubation.

