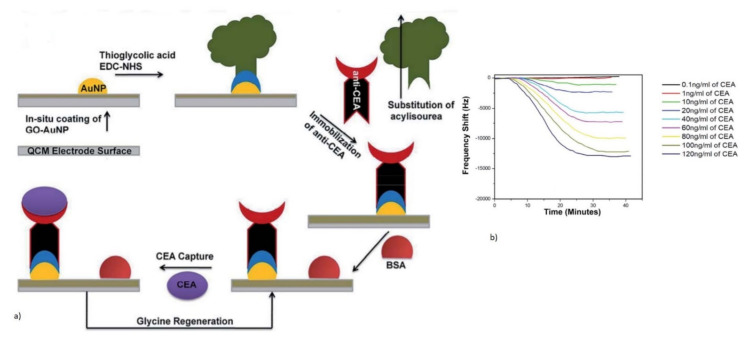
Figure 8.
(a) Schematic of the surface functionalization of the anti-CEA antibody and sensing. (b) Increase in the resonant frequency shift with the CEA concentration [112]. Reproduced with permission from P. J. Jandas et al. [112], copyright 2020, RSC Advances; published by The Royal Society of Chemistry, Creative Commons (open access).

