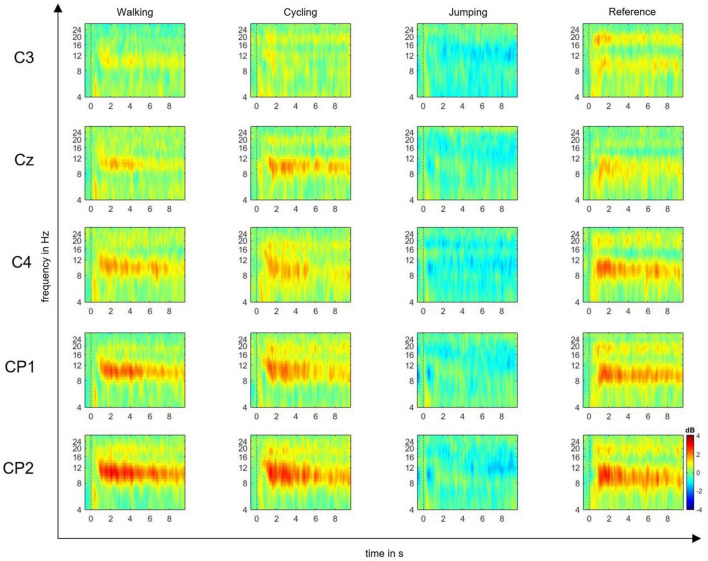
FIGURE 2.
Event-related spectral perturbation (ERSP) plots. ERSP plots show mean changes in spectral power during the motor imagery (MI) epoch, relative to a –200-ms pre-stimulus baseline. Plots are shown for the electrode positions C3, Cz, C4, CP1, and CP2, and the four experimental conditions: MI of walking, cycling, jumping, and reference. The red color represents the ERS, whereas the blue color represents the ERD in decibel (dB) (range: ± 4).

