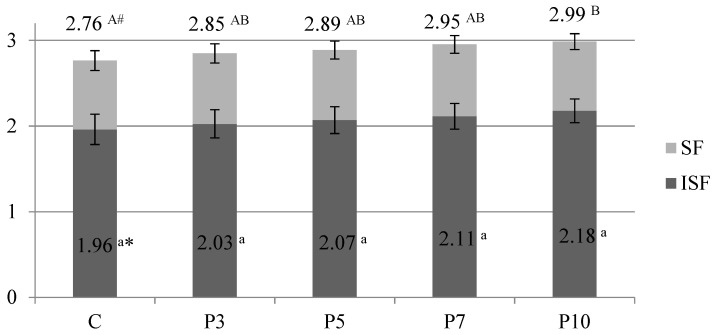
Figure 1.
Fiber content in the analyzed pasta samples (g/100 g dry matter). C—control (semolina pasta); P3, P5, P7, P10—pasta samples with 3, 5, 7, 10 percentage replacement of semolina flour with spirulina powder. The bars show the total fiber content divided into a dark grey part (insoluble fiber content, ISF) and a light grey part (soluble fiber content, SF). Bars represent means ± standard deviation, (n = 3, for each pasta variant). * The values refer to the ISF content, marked with the same lowercase letter (a) are not significantly different (p < 0.05). # The values refer to the total fiber content, marked with different capital letters (A, B) are significantly different (p < 0.05).

