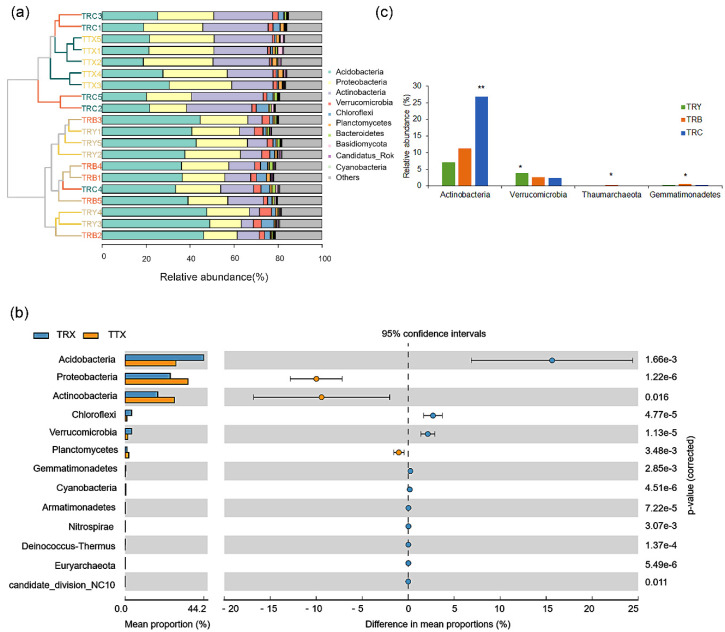
Figure 3.
The relative abundance and differences of rhizosphere microbiome (at phylum) in C. henryi. (a) Relative abundance (%) of the major taxonomic distribution at Phylum. (b) The pairwise comparison difference at phyla were calculated with Welch’s t-test. (c) The multiple comparisons comparison difference at phyla were calculated with Kruskal–Wallis rank-sum test. * Correlation is significant at p < 0.05; ** Correlation is significant at p < 0.01; TRY, TRC, and TRB, three cultivated varieties of plantation; TTX, natural forest; TRX, plantation.

