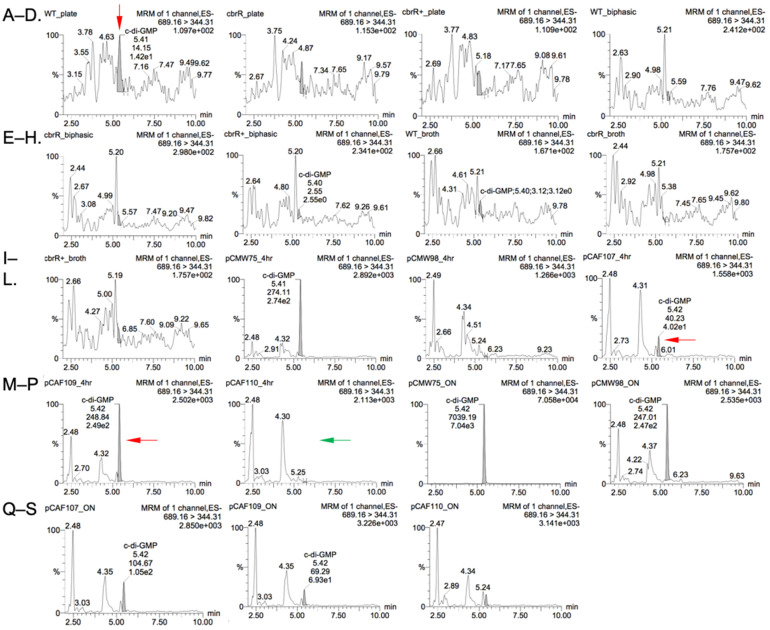
Figure 11.
LC-MS/MS shows low level amounts of c-di-GMP produced by C. jejuni CbrR. Chromatograms generated by LC-MS/MS show peak intensity of c-di-GMP for samples of C. jejuni cells: (A) WT Plate, (B) cbrR− Plate, (C) cbrR+ Plate, (D) WT Biphasic, (E) cbrR− Biphasic, (F) cbrR+ Biphasic, (G) WT Broth, (H) cbrR− Broth, (I) cbrR+ Broth; and E. coli cells: (J) pCMW75 4 Hr, (K) pCMW98 4 Hr, (L) pCAF107 4 Hr, (M) pCAF109 4 Hr, (N) pCAF110 4 Hr, (O) pCMW75 O/N, (P) pCMW98 O/N, (Q) pCAF107 O/N, (R) pCAF109 O/N, (S) pCAF110 O/N. WT C. jejuni and recombinant E. coli (WT CbrR or CbrRE334A) samples showed low level c-di-GMP production.

