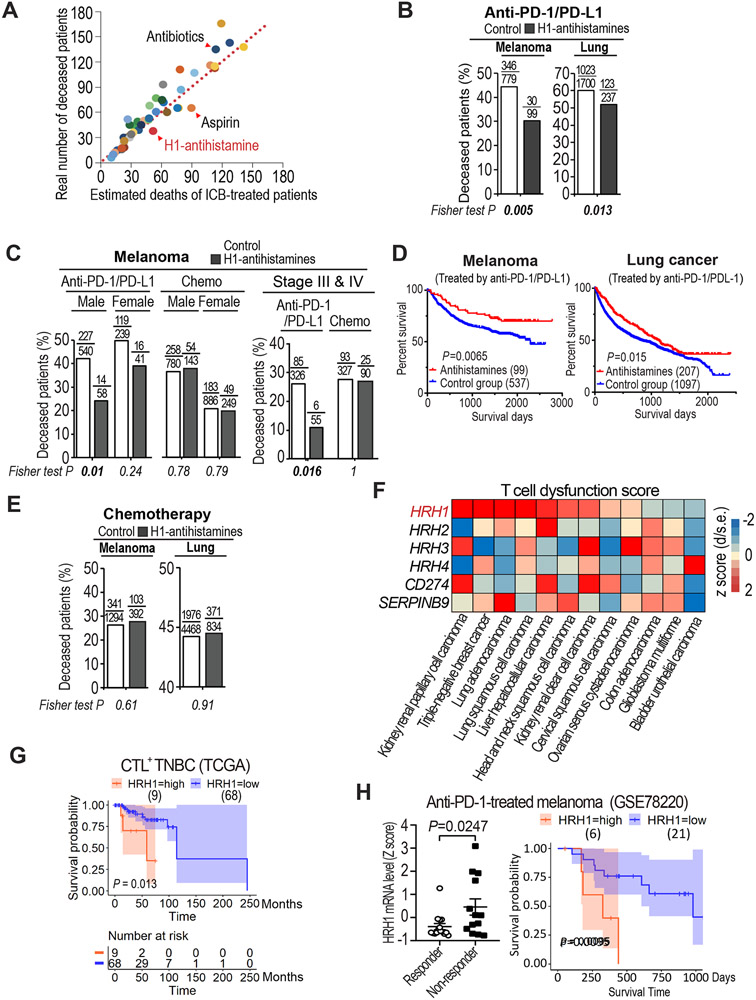
Figure 1. Uptake of antihistamines correlated with better survival in ICB-treated patients and HRH1 expression is associated with T cell dysfunction.
(A) Scatter plot of the real numbers of deceased melanoma patients who took various commonly-used medicines (40 different drugs as listed in Table S1) during ICB treatment versus their estimated deaths (at 39% death rate based on 336 deceased patients out of total 865 ICB-treated patients at MDACC). Each dot represents a group of patients who took one type of medicine along with ICB.
(B) Percentages of deceased cancer patients taking H1-antihistamines during anti-PD-1/PD-L1 treatment versus those did not (Fisher exact test).
(C) Percentages of deceased melanoma patients who took H1-antihistamines during anti-PD-1/PD-L1 treatment or chemotherapy compared with sex- or stage-matched melanoma patients who did not.
(D) Kaplan-Meier overall survival analysis of cancer patients taking H1-antihistamines during anti-PD-1/PD-L1 treatment versus those who did not.
(E) Percentages of deceased cancer patients taking H1-antihistamines during chemotherapy treatment versus those did not (Fisher exact test).
(F) T cell dysfunction scores of HRH1-4 in indicated cancer types assessed by TIDE. T cell dysfunction score is defined as the z score of d/standard error (s.e.) following previous publication (Jiang et al., 2018).
(G) Kaplan-Meier overall survival analysis for CTL+ TNBC patients based on HRH1 level detected in tumors. The numbers at risk are the stratified HRH1 level high and low patient numbers of those who remained alive and uncensored after a certain time period.
(H) HRH1 mRNA expression in pre-treatment tumors of responder (n=15) versus non-responder (n=13) melanoma patients (t-test), and comparison of overall survival of melanoma patients who had high HRH1 vs. low HRH1 expressed in the tumors before anti-PD-1 treatment (GSE78220).
Mean±SEM, *P<0.05.

