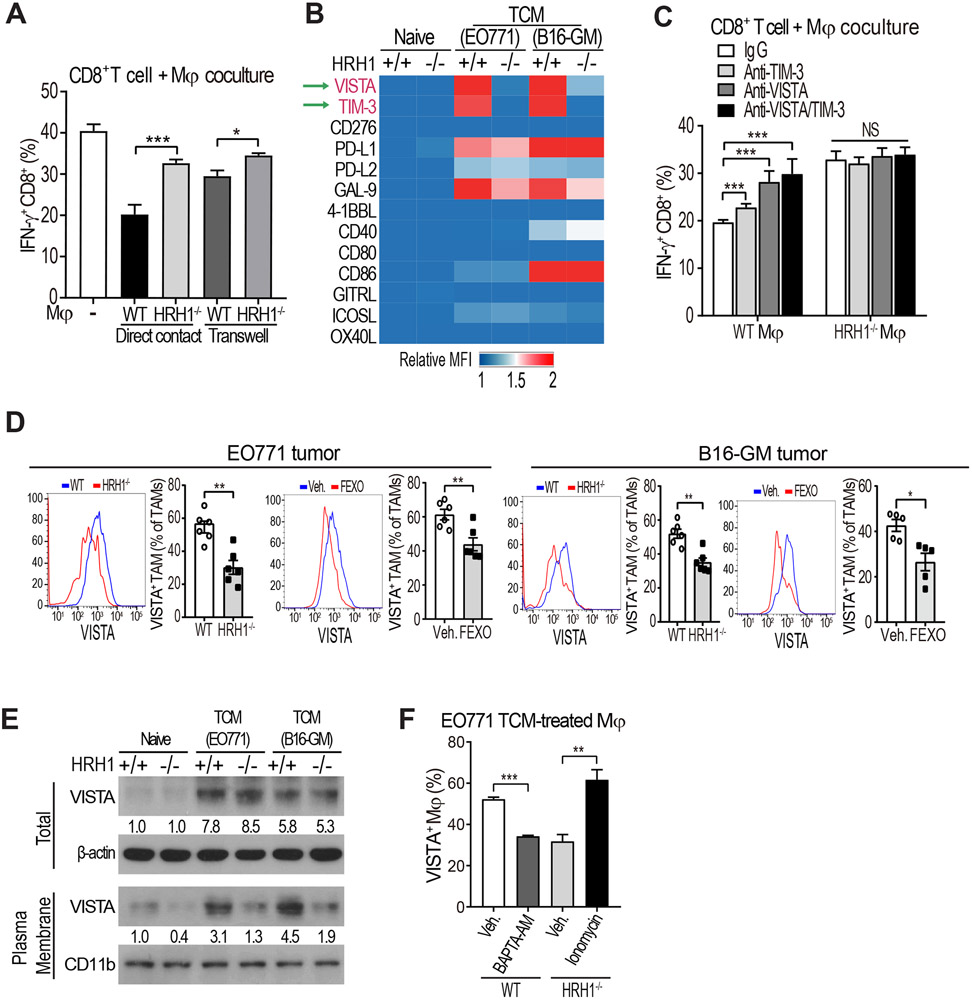
Figure 4. Histamine-HRH1 activation promotes VISTA membrane localization.
(A) Percentages of IFN-γ+ CD8+ T cells co-cultured with EO771 TCM-treated WT or HRH1−/− BMDMs in direct contact or separately in transwells (n=6, t-test).
(B) Heat-map depicting relative expression of co-stimulatory/inhibitory molecules on naïve or TCM-treated WT or HRH1−/− BMDMs measured by flow cytometry. The mean fluorescence intensity (MFI) of each molecule was normalized to the MFI of the naïve WT group.
(C) Percentages of IFN-γ+ CD8+ T cells co-cultured with EO771 TCM-treated WT or HRH1−/− BMDMs pretreated with IgG, anti-TIM-3 (10 μg/ml) and/or anti-VISTA (10 μg/ml) antibodies (n=3-4, one-way ANOVA).
(D) Flow cytometry analysis of VISTA+ TAMs (CD45+ CD11b+ F4/80+) from EO771 and B16-GM tumors growing in WT versus HRH1−/− mice, and vehicle-treated versus FEXO-treated WT mice (n=5-6, t-test).
(E) Western blot analysis of total VISTA and membrane VISTA expression on naïve or TCM-treated WT or HRH1−/− BMDMs. β-actin and CD11b were used as loading controls.
(F) Percentages of VISTA+ BMDMs after treatment with 10 μM BAPTA-AM (an intracellular calcium chelator) or 1 μg/ml ionomycin-Ca2+ (n=3, t-test).
All in vitro experiments were performed at least twice. Mean ± SEM, *P<0.05, **P<0.01, ***P<0.001, NS: not significant.
See also Figure S6.

