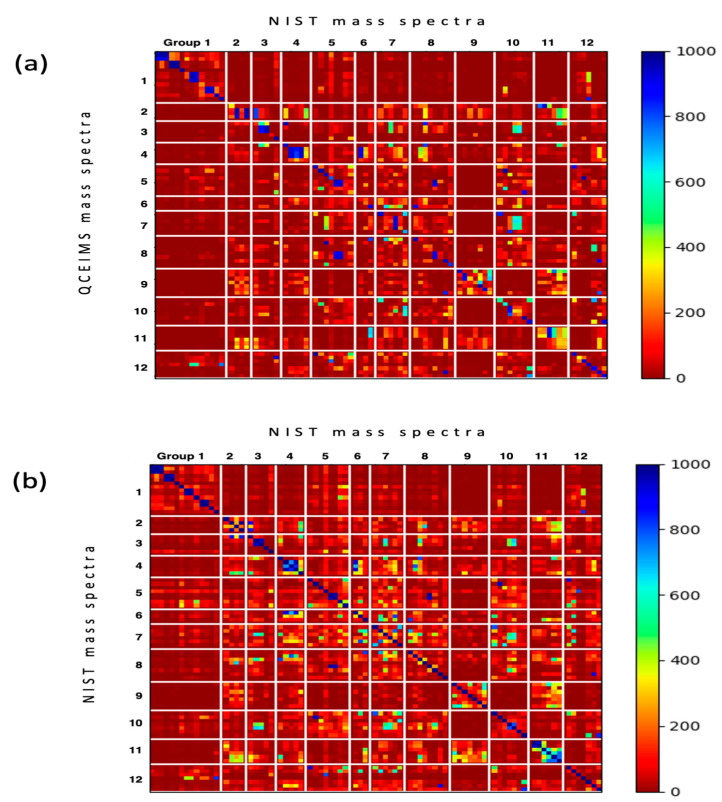
Figure 4.
Heatmaps of weighted dot product similarity scored mass spectra sorted by the 12 subclasses of purines and pyrimidines. (a) Matching the 80 QCEIMS predicted versus all experimental mass spectra in the NIST 17 library. (b) Matching the target 80 experimental NIST 17 spectra of purines and pyrimidines versus all experimental mass spectra in the NIST 17 library.

