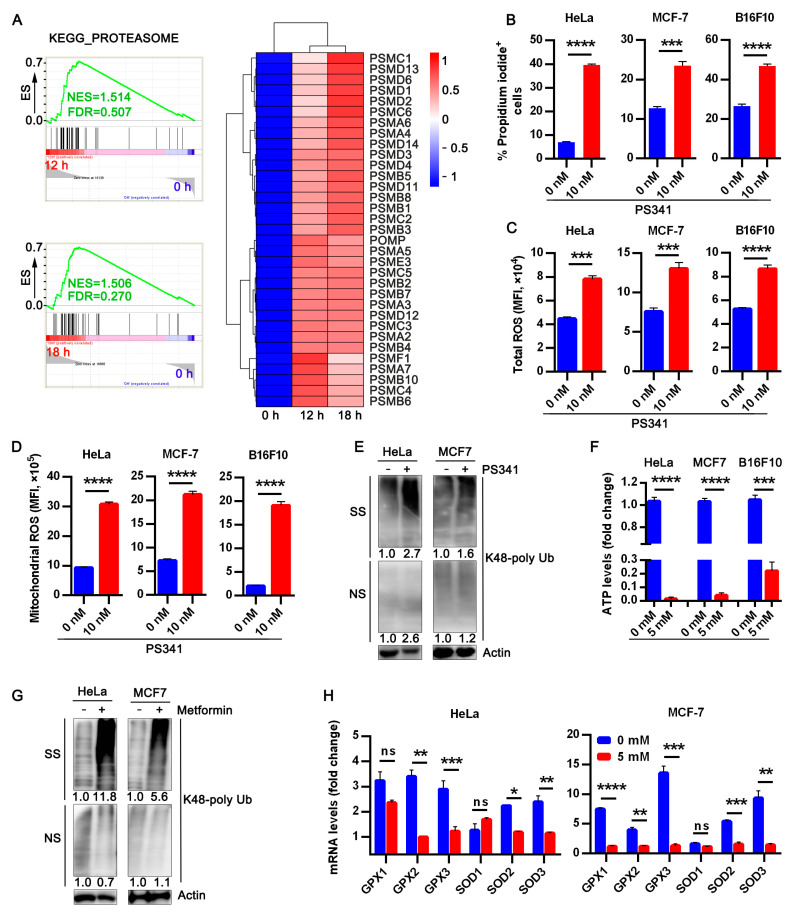
Figure 3.
Metformin abrogates upregulated proteasome activity in ECM detached tumor cells. (A) GSEA for the enrichment of proteasome genes of HeLa in suspension at 12 and 18 h anchorage-independent growth compared to anchorage-dependent cells at 0 h. The heat map shows expression patterns for the genes contributing to core enrichment of proteasome activity; (B) flow cytometry assay data for percentage propidium iodide +HeLa, MCF-7, and B16F10 treated with 10 nM PS341 in ECM detached condition for 24 h; (C) flow cytometry data for total ROS quantification in tumor cells treated with PS341 measured as mean fluorescence intensity in cells stained with CM-H2DCFDA; (D) flow cytometry mean fluorescence intensity quantification of mitochondria ROS in HeLa, MCF-7, and B16F10 cells following PS341 treatment for 24 h; (E) Western blot of K48 polyUb-transformed proteins in 24 h PS341 untreated or treated detached HeLa and MCF-7, NS and SS portions are presented. NS—NP40 soluble portion, SS—SDS soluble portion. The uncropped western blot images of Figure 3E are in Supplementary material Figures S2 and S3; (F) luminance intracellular ATP level of metformin-treated cells presented as fold change relative to the controls; (G) blot of K48 polyUb-transformed proteins in 24 h metformin treated detached HeLa and MCF-7 cells, NS and SS portions are presented. NS—NP40 soluble portion, SS—SDS soluble portion. Uncropped western blot images of Figure 3G are provided in Supplementary Figures S4 and S5; (H) RT-qPCR relative mRNA level of antioxidant genes in HeLa and MCF-7 following treatment with metformin for 24 h. Data represent means ± SEM, (n = 3) * p < 0.05, ** p < 0.01, *** p < 0.001 **** p < 0.001 typical data from at least three independent experiments with similar results.

