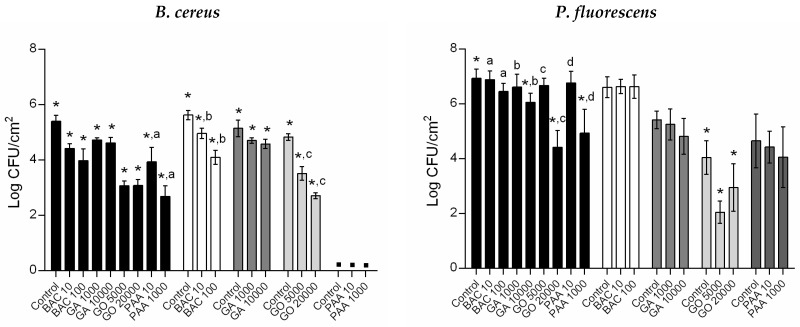
Figure 4.
Log CFU/cm2 for exposed and unexposed (control) regrown biofilms of untreated and persister cells of B. cereus and P. fluorescens. Each selected biocide (BAC, GA, GO, and PAA) was tested at two distinct concentrations (in µg/mL). Values are mean ± SDs of three independent assays with two replicates. Legend: regrown biofilms of untreated cells (■); regrown biofilms of persister cells after BAC treatment (□), GA treatment ( ), GO treatment (
 ), and PAA treatment (
 ). ▪—no detectable/significant regrown biofilms. *—Surviving cells from biocide exposure were significantly lower compared to unexposed regrown biofilms (control) for each population (Dunnett’s multiple comparisons test, p < 0.05); a, b, c, and d—Surviving cells were significantly different from distinct biocide concentration exposure (unpaired t-test with Welch’s correction, p < 0.05).

