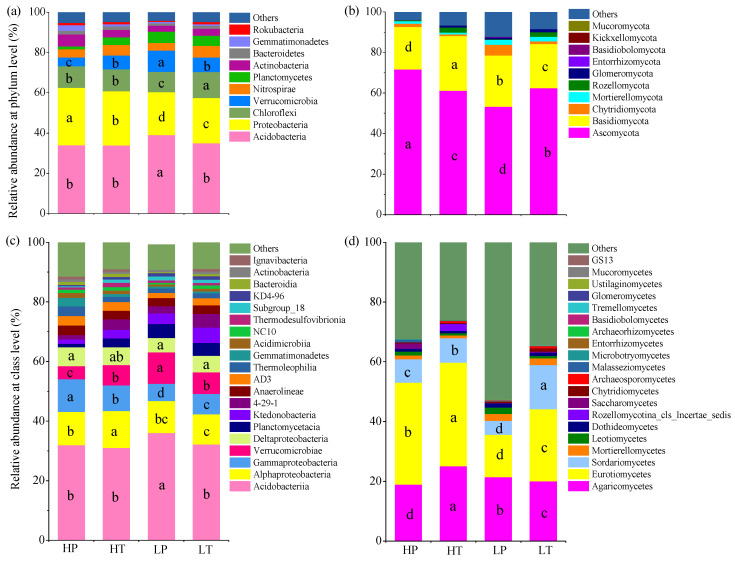
Figure 3.
Relative abundances of soil microbial communities at phylum and class levels in different groups. (a) Bacteria at phylum level; (b) fungi at phylum level; (c) bacteria at class level; (d) fungi at class level. HP denotes P. hydropiper community at high level above the water table, HT indicates T. lutarioriparia community at high level above the water table, LP signifies P. hydropiper community at low level above the water table, and LT refers to T. lutarioriparia community at low level above the water table. Different lowercase letters represent significant differences among groups (p < 0.05).

