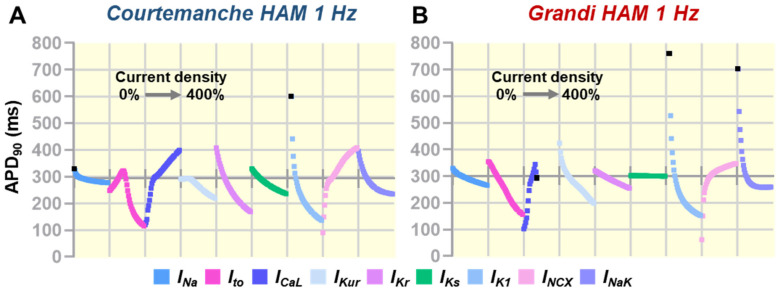
Figure 1.
(A,B) The effect of Gmax perturbations (0% to 400%) on APD90 between models. Each segment on the horizontal axes corresponds to a range of perturbations. Traces were discontinued (marked as black squares) when no APD90 could be measured (e.g., repolarization failure/plateau arrest). The position of the horizontal axes indicates the baseline APD90 for each model (100% Gmax).

