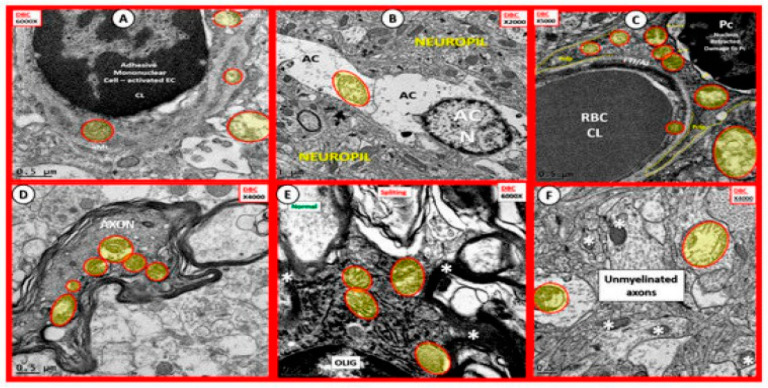
Figure 8.
Aberrant Mitochondria in Brain Endothelial cells (EC), Astrocytes (AC), Pericytes (Pc), Myelinated and Unmyelinated Neurons and Oligodendrocytes (OLIG) in the Diabetic db/db Models. The aberrant mitochondria (aMt) are pseudo-colored yellow with red outlines in order to allow for rapid identification. Panels (A–F) demonstrate aberrant mitochondria (aMt) in each of the brain cells depicted. Panel (A) depicts aMt in ECs and adjacent AC foot processes. Panel (B) depicts an aMt within the cytoplasm of an AC. Panel (C) depicts multiple aMt in the cytoplasm of a Pc. Panel (D) depicts aMt within a myelinated neuronal axon that also demonstrates separation of its lining myelin sheath. Panel (E) depicts aMt in an oligodendrocyte’s cytoplasm. Panel (F) depicts aMt with the axoplasm of an unmyelinated neuronal axon. Note that most of the aMt are hypolucent as a result of the loss of their normal electron dense matrix proteins and they share a common feature of attenuated and or loss of their crista; they are also enlarged. Magnifications are located in the upper part of each panel and the scale bars are at the bottom. The images in this figure were modified with permission by CC 4.0 [27].

