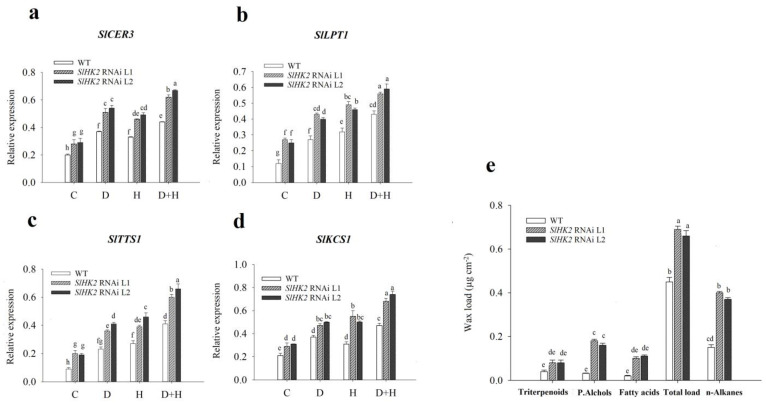
Figure 3.
Transcript levels of (a) SlCER3, (b) SlLPT1, (c) SlTTS1, (d) SlKCS1, and (e) cuticular wax accumulation, in leaves of WT and SlHK2 RNAi plants. For the quantitative real-time PCR analysis, the plants were used after five days of well-watered (C), drought (D), heat (H), and combined stress (D + H) conditions. The relative expression levels were determined by quantitative real-time PCR using the SlActin gene as reference. The well-watered SlHK2 RNAi and WT plants were used to determine cuticular waxes. Cuticular waxes were extracted and analyzed using GC-MS. Values represent mean ± SE (n = 6). Different letters indicate significant differences among treatments at p < 0.05.

