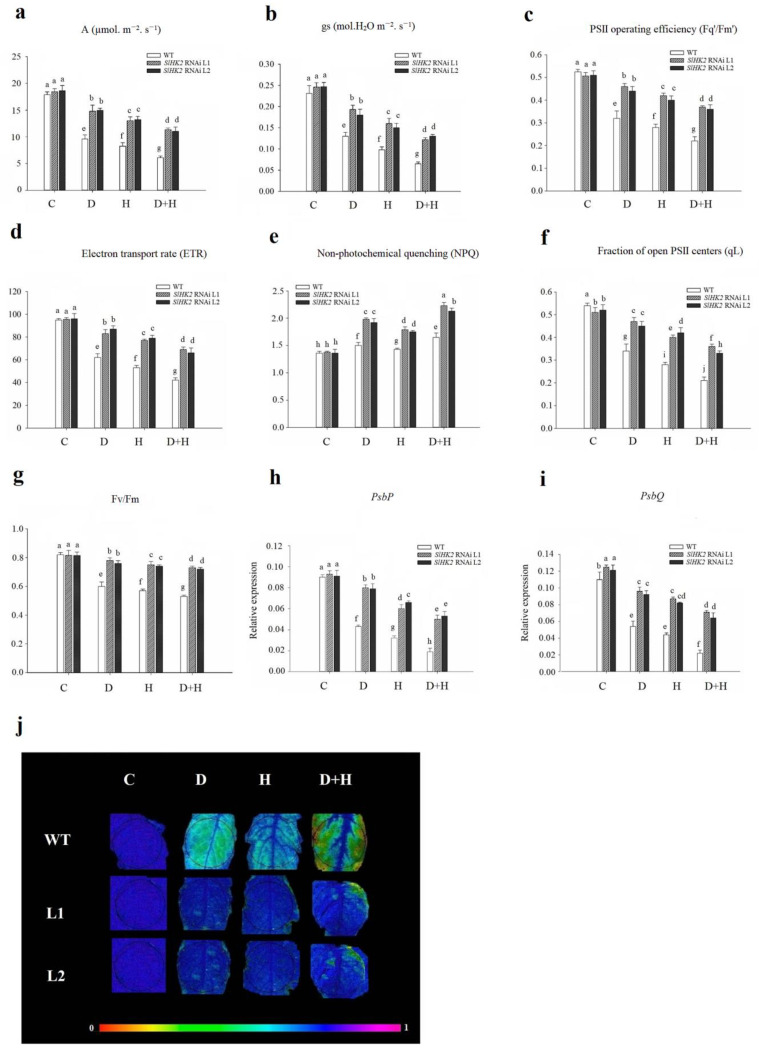
Figure 4.
(a) Photosynthetic rate (A, in µmol m−2s−1), (b) stomatal conductance (gs, in µmol H2O m−2s−1), (c) PSII operating efficiency (Fq’/Fm’), (d) electron transport rate (ETR), (e) non-photochemical quenching (NPQ), (f) the fraction of open PSII centers (qL), (g) maximum photochemical yield of photosystem II (Fv/Fm), (h) transcript levels of the photosystem II oxygen-evolving complex protein gene (PsbP), (i) photosystem II oxygen-evolving complex protein gene (PsbQ), and (j) chlorophyll fluorescence imaging (Fv/Fm), in leaves of WT and SlHK2 RNAi lines (L1 and L2). The color range shows the plants’ values from black (minimum) to pink (maximum) in chlorophyll fluorescence imaging. Spots on the leaf circle display areas damaged by these stresses in (j). The relative expression levels were determined by quantitative real-time PCR (using SlActin gene as reference). Different letters show significant differences among treatments at p < 0.05.

