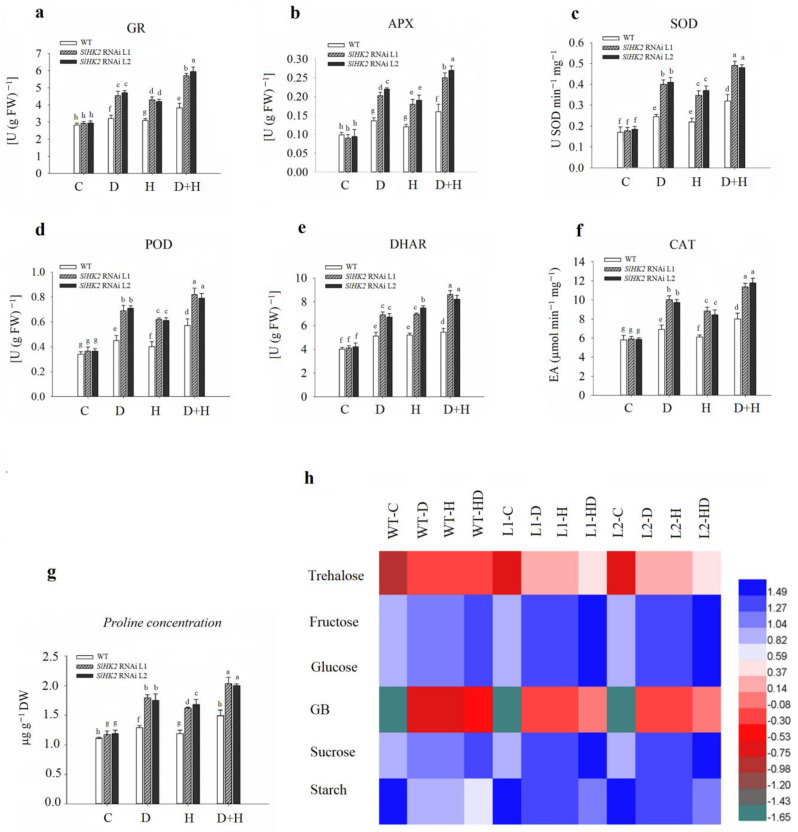
Figure 6.
The activities of (a) glutathione reductase (GR), (b) ascorbate peroxidase APX, (c) superoxide dismutase (SOD), (d) peroxidase (POD), (e) dehydroascorbate reductase (DHAR), (f) catalase (CAT), (g) proline, and (h) osmoprotectants in leaves of the WT and SlHK2 RNAi tomato plants under drought (D), heat (H) and combined (D + H) stresses. Blue represents a higher relative concentration, while green represents the lower relative concentration of the heat map in WT and SlHK2 RNAi lines (L1 and L2). Values represent mean ± SE (n = 6). Different letters indicate significant differences among treatments at p < 0.05.

