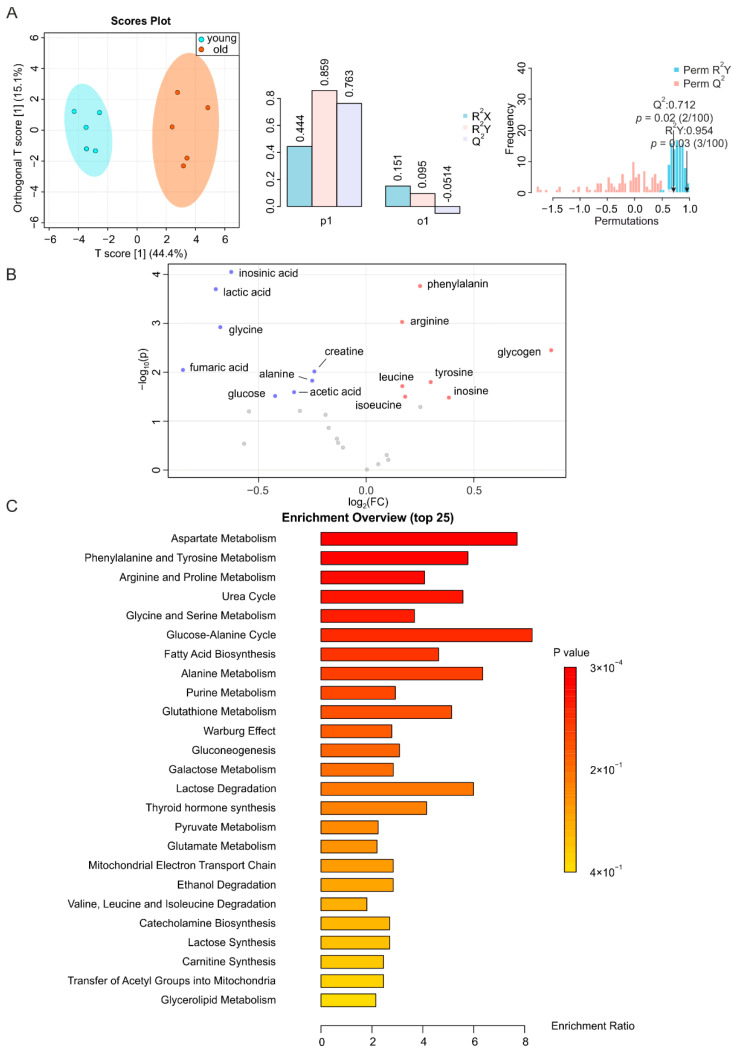
Figure 2.
NMR-based metabolomics analysis of skeletal muscle. (A) O-PLS-DA plot and cross validation of skeletal muscle samples from young (blue) and old (orange) mice (left), with n = 5 each, and permutation between the predictive component (p1) and orthogonal components (o1) with cross-validated R2X, R2Y, and Q2 coefficients (middle), and histogram showing the permutation test with permutation number n = 100 (right). (B) Volcano plot of differentially regulated metabolites in skeletal muscle from aged and young mice. Increased (red) and decreased (blue) metabolites delimitate the fold change over aging, while grey dots denote insignificantly changed metabolites. (C) MSEA of affected metabolites in search of their functional relevance.

