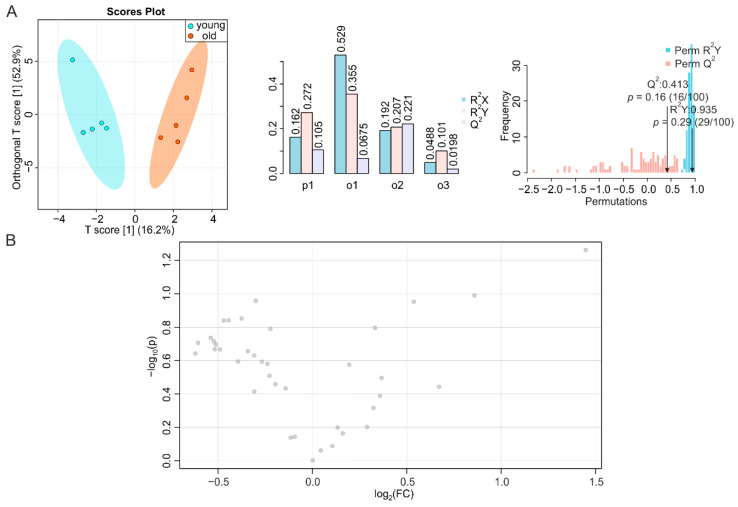
Figure 6.
NMR-based metabolomics analysis of jejunum. (A) O-PLS-DA plot and cross validation of jejunum samples from young (blue) and old (orange) mice (left), with n = 5 each, and permutation between predictive component (p1) and three orthogonal components (o1, o2, o3) with cross-validated R2X, R2Y, and Q2 coefficients (middle), and histogram showing permutation test with permutation number n = 100 (right). (B) Volcano plot of differentially regulated metabolites in the jejuna of young and aged mice. Grey dots denote insignificantly changed metabolites.

