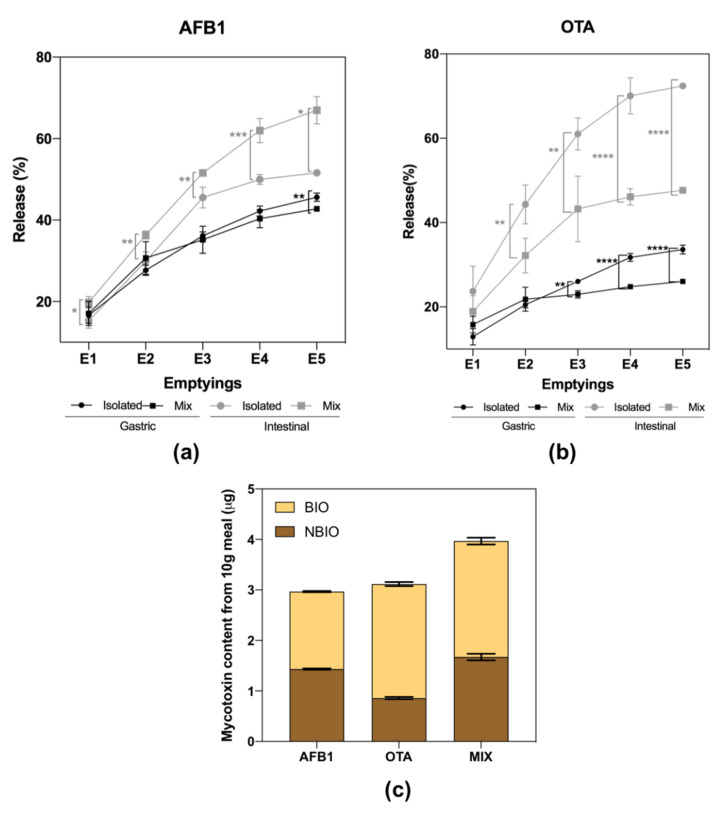
Figure 1.
Bioaccessibility of AFB1 (a) and OTA (b) during semi-dynamic gastro-duodenal digestion. The graphs represent the cumulative release of AFB1 and OTA in each gastric emptying and respective duodenal digestion when digested isolated or as a mixture. (c) Mycotoxins’ distribution along intestinal emptying (IE1 to IE5) and the content that remained in the non-bioaccessible fraction (NBIO). Data are presented as the mean ± SD of four replicates (n = 4). Parametric (t-test) or non-parametric (Mann–Whitney) statistical tests were applied to compare AFB1 or OTA release, isolated or in combination, and statistical differences are indicated as * p < 0.05, ** p < 0.01, *** p < 0.001, and **** p < 0.0001. E1 to E5 mean emptying 1 to emptying 5.

